Download presentation
Presentation is loading. Please wait.

1
Michele Milella Oncologia Medica A Istituto Nazionale Tumori Regina Elena Roma

2
Disclosures I have very strong opinions on this talk’s topic and will try to force and bend available evidence to convince you that I’m right.

3
…In the beginning was Motzer! Poor risk (20%) Median PFS: 2.5 mos Median OS: 5 mos 1-yr OS: 20% 2-yr OS: 6% 3-yr OS: 2%
 Median PFS: 2.5 mos Median OS: 5 mos 1-yr OS: 20% 2-yr OS: 6% 3-yr OS: 2%.")
4
The CCF extension Poor risk (28%) Median OS: 7.3 mos 1-yr OS: 23%
 Median OS: 7.3 mos 1-yr OS: 23%")
5
…but they were meant for immuno/chemotherapy-treated patients! MSKCC CCF

6
What do we REALLY know? (I mean: high-quality scientific evidence…)
")
7
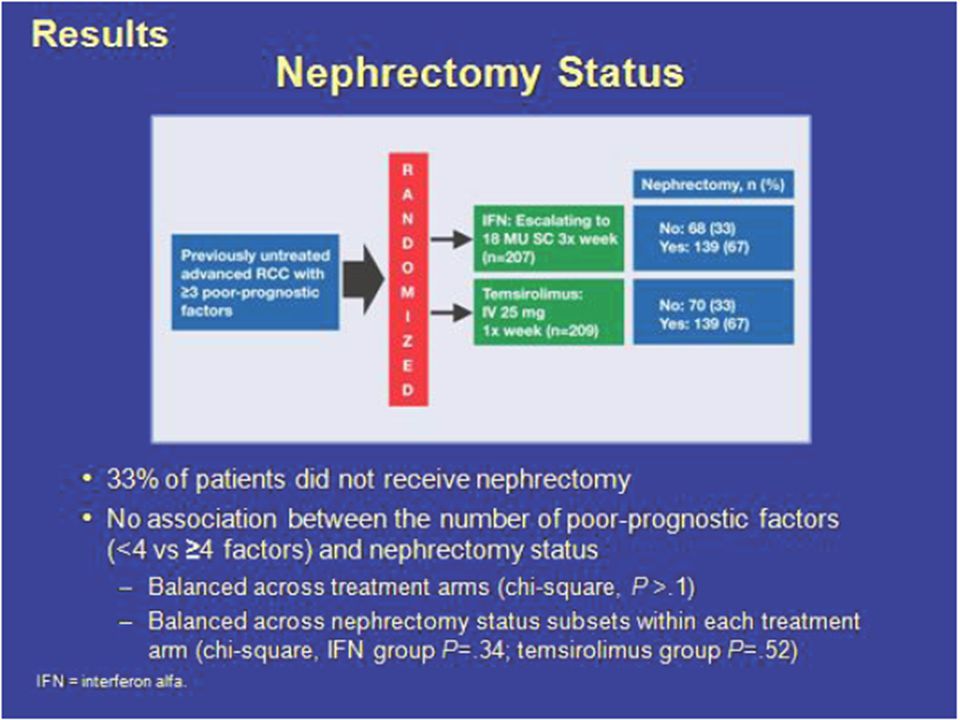
The Global ARCC Study: Trial Design Stratification by: Geographical Regions: EU + AU + CA (21%) US (29%) Other (50%) Nephrectomy: Nephrectomy:YesNo TORISEL 15-mg IV once weekly plus IFN-α 6 MU 3 times weekly (n=210) RANDOMIZERANDOMIZERANDOMIZERANDOMIZE escalating to 18 MU SC 3 times weekly (n=207) IFN-α escalating to 18 MU SC 3 times weekly (n=207) TORISEL 25-mg IV once weekly (n=209) Hudes et al. N Engl J Med. 2007;356:2271-2281.

8
Main Inclusion Criteria: Poor Prognostic Factors Karnofsky performance status 60 or 70 Hemoglobin less than the lower limit of normal (LLN) Less than 1 year from time of initial RCC diagnosis to randomization Corrected serum calcium > 10 mg/dL Lactate dehydrogenase > 1.5 times the upper limit of normal (ULN) More than 1 metastatic organ site of disease (sites defined as different tissues with metastasis: lung, liver, bone, kidney, lymph node, etc.) Patients had at least 3 of 6 “poor prognostic factors” for shortened survival listed below: Hudes et al. N Engl J Med. 2007;356:2271-2281.

9
Baseline Characteristics /Subgroups (ITT Patient Population) IFNTORISEL IFN + TORISEL Total ITT Population 207209210626 Subgroups by Protocol-defined Prognostic Factors: >3 of 6 Factors, n(%) 196 (95%) 195 (93%) 198 (94%) 589 (94%) <3 of 6 Factors 11 (5%) 14 (7%) 12 (6%) 37 (6%) TOTAL207209210 626 (100%) Hudes et al. N Engl J Med. 2007;356:2271-2281.

10
Baseline Characteristics Poor Prognostic Factors (ITT Population) Poor Prognostic FactorsIFNTORISEL IFN + TORISEL TOTAL ITT Population 207209210626 MSKCC Risk Factors: LDH > 1.5 X upper limit of normal 48 (23%) 36 (17%) 33 (16%) 117 (19%) Hemoglobin < lower limit of normal 168 (81%) 172 (82%) 178 (85%) 518 (83) Corrected calcium > 10 mg/dL 72 (35%) 54 (26%) 58 (28%) 184 (29%) Time from diagnosis to first treatment < 1 y 164 (79%) 174 (83%) 179 (85%) 517 (83%) Karnofsky Performance Status 60-70 171 (83%) 168 (80%) 177 (84%) 516 (82%) Additional Poor Prognostic Factors: >2 Sites of Metastasis 165 (80%) 166 (79%) 168 (80%) 499 (80%) Hudes et al. N Engl J Med. 2007;356:2271-2281. Treatment arms generally well balanced for prognostic factors Treatment arms generally well balanced for prognostic factors

11
Primary Endpoint Median Overall Survival 1.00 0.75 0.50 0.25 0.00 051015202530 TORISEL (N=209) IFN-α (N=207) Time From Registration, Months Treatment with TORISEL was associated with a 49% increase in median OS compared with IFN- α Probability of Survival Median Overall Survival TORISEL10.9 months IFN-α7.3 months P value0.0078 Hazard ratio (95% CI)0.73 (0.57-0.92) TORISEL + IFN-α (N=207) Hudes et al. N Engl J Med. 2007;356:2271-2281.

12
Secondary Endpoints ParameterTORISEL(n=209) IFN-α (n=207) % Difference P HR (95% CI) † Median PFS ‡ by independent review Months (95% CI) 5.5 mos (3.9, 7.0) 3.1 mos (2.2, 3.8) 77%0.0001 0.66 (0.53, 0.81) Median TTF § Months (95% CI) 3.8 mos (3.5, 3.9) 1.9 mos (1.7, 1.9) 100%<0.0001 0.61 (0.50, 0.74) Overall response rate % (95% CI) 8.6% (4.8, 12.4) 4.8% (1.9, 7.8) 79%0.1232NA Clinical benefit rate % (95% CI) 32.1% (25.7, 38.4) 15.5% (10.5, 20.4) 107%<0.0001NA Hudes et al. N Engl J Med. 2007;356:2271-2281.

13
Geographic area US122 W EU, Canada, Australia87 Asia-Pacific, E EU, Africa, S Amer207 Corrected serum calcium level ≤10 mg/mL276 >10 mg/mL126 LDH level ≤1.5 x ULN315 >1.5 x ULN84 Hemoglobin level <1 x LLN340 ≥1 x LLN76 Diagnosis to randomization <1 y338 ≥1 y78 Histology Clear cell339 Other73 Nephrectomy Yes278 No138 Karnofsky performance status ≤70340 >7075 Sex Male287 Female129 Age <65 y287 ≥65 y129 Overall Survival Across Patient Subgroups 0.00.51.01.52.0 TORISEL Better Interferon- Better Hazard Ratio (95% CI)No. of PatientsSubgroup Hudes et al. N Engl J Med. 2007;356:2271-2281.

14
Variable IFNTORISEL NOS 1 (CI) 2 NOS (CI)HRP ITT Population 207 7.3 (6.1-8.8) 209 10.9 (8.6-12.7) 0.780.0252 Subgroups by Protocol-defined Poor Prognostic Factors: >3>3>3>3196 6.9 (5.6-8.3) 196 10.9 (8.6-12.9) 0.730.0020 <311 NA (20.6-NA) 13 10.2 (6.9-15.4) 4.930.0052 Subgroups by MSKCC Risk Factors: Poor Risk 156 6.0 (4.3-7.1) 145 10.2 (7.6-11.7) 0.700.0014 IntermediateRisk 51 51 17.7 (11.3-24.2) 64 64 13.0 (9.9-15.4) 1.170.2441 OS by Prognostic Factors (ITT Population) 1 Median Overall Survival in months 2 95% Confidence Interval Hudes et al. N Engl J Med. 2007;356:2271-2281.

15
Poor prognosis patients: Who are they???? 50 yr-old male mRCC (synchronous) Nefrectomized Hb 13.8 LN and pulmonary nodules KPS 100% 80 yr-old female mRCC (synchronous) No nefrectomy Hb 9.8 Corrected Ca ++ 3.45 LN, lung, bone, pancreas KPS 60% Are they the same??? Would you treat them the same???
 Nefrectomized Hb 13.8 LN and pulmonary nodules KPS 100% 80 yr-old female mRCC (synchronous) No nefrectomy Hb 9.8 Corrected Ca LN, lung, bone, pancreas KPS 60% Are they the same . Would you treat them the same .")
16
So, Tem is the standard of care for poor risk mRCC pts… …but, what are the alternatives?

17
Well, targeting the VEGF axis could be an alternative, many would say…

18
…but, based on which data? Treatment (% of the overall population) median OS (95% CI) Registration trial Sunitinib (6%) 5.3 mos (4.2-10.0) IFN (7%) 4.0 mos (2.7-7.2) EAP Sunitinib (n=373) 5.3 mos (4.6-6.4) Heng 2008 Sunitinib (n=61)6.4 mos Sunitinib ASCO 2008; abstr 16057
 median OS (95% CI) Registration trial Sunitinib (6%) 5.3 mos ( ) IFN (7%) 4.0 mos ( ) EAP Sunitinib (n=373) 5.3 mos ( ) Heng 2008 Sunitinib (n=61)6.4 mos Sunitinib ASCO 2008; abstr")
19
…but, based on which data? Bevacizumab/IFN AVOREN CALGB

20
…but, based on which data? Sorafenib Pazopanib No data available JCO 2009 Cancer 2011 Ann Oncol 2011 JCO 2010

21
mTTP: 5.0 mos (3.5-6.5) mOS: 9.3 mos (7.3-11.5)
 mOS: 9.3 mos ( )")
22
Temsirolimus Sunitinib Bevacizumab/IFN Median OS (with 95% CI) for mRCC patients classified as poor-risk by classical MSKCC criteria upon treatment with selected targeted agents
 for mRCC patients classified as poor-risk by classical MSKCC criteria upon treatment with selected targeted agents")
23
So, Sunitinib would be the ONLY alternative… but in which patients??? Poor risk by classical MSKCC criteria Poor risk by modified MSKCC criteria Intermediate risk by classical MSKCC criteria Poor risk by both criteria

24
And it’s getting more…

25
…and more complicated!!!

26
Risk stratification in the targeted agent era

27
Validation of the IDC model Poor risk (30%) Median OS: 7.8 mos
 Median OS: 7.8 mos")
28
… and yet, we are missing something!

29
But don’t forget other things maybe important too…

30
Cytoreductive Surgery Flanigan RC, NEJM 345:1655, 2001 Mickisch, Lancet 358:966, 2001 SWOG 8949 n=246EORTC Trial n=85 OS=11 vs 8.1 months OS= 17 vs 7 months IFN Nephrectomy + IFN

31
Cytoreductive Surgery GroupYearNMS Nephrectomy + IFN MS IFN p SWOG2001246119<0.05 EORTC2001851811< 0.05 Flanigan (combined) 200433113.67.8< 0.05 31% decrease in risk of death with nephrectomy Flanigan RC J Urol 171:1071, 2004 Eligibility data: ECOG PS 0-1, clear cell histology, primary resectable lack of CNS, liver or extensive bone metastases Absolute benefit diminishes in poor risk groups We don’t know what mechanism underlies the improvement in survival
 < % decrease in risk of death with nephrectomy Flanigan RC J Urol 171:1071, 2004 Eligibility data: ECOG PS 0-1, clear cell histology, primary resectable lack of CNS, liver or extensive bone metastases Absolute benefit diminishes in poor risk groups We don’t know what mechanism underlies the improvement in survival")
32
RCC Consortium Database N= 314 (37% Poor Risk by Heng) RiskNOS CN - OS CN + HRC.I.P Favorable23 Intermediate14313.127.50.460.27 – 0.780.004 Poor1175.89.80.670.44 – 1.010.056 Benefit of cytoreductive nephrectomy seems to be marginal in poor risk group Choueiri TK, J Urol 185: 60-66, 2011 Pts treated with Sunitinib, Sorafenib, Bevacizumab Retrospective data
 RiskNOS CN - OS CN + HRC.I.P Favorable23 Intermediate – Poor – Benefit of cytoreductive nephrectomy seems to be marginal in poor risk group Choueiri TK, J Urol 185: 60-66, 2011 Pts treated with Sunitinib, Sorafenib, Bevacizumab Retrospective data")
33
Upfront Nephrectomy in Poor Risk? Poor Risk Poor Performance status Unresectable Primay Tumor Upfront Systemic Therapy Poor Risk Resectable Primay Tumor Upfront Therapy Improvement in Overall Patient Status Nephrectomy??

37
The same does not apply to patients treated with VEGF inhibitors… Heng, JCO 2009

38
And don’t forget other things maybe important too…

39
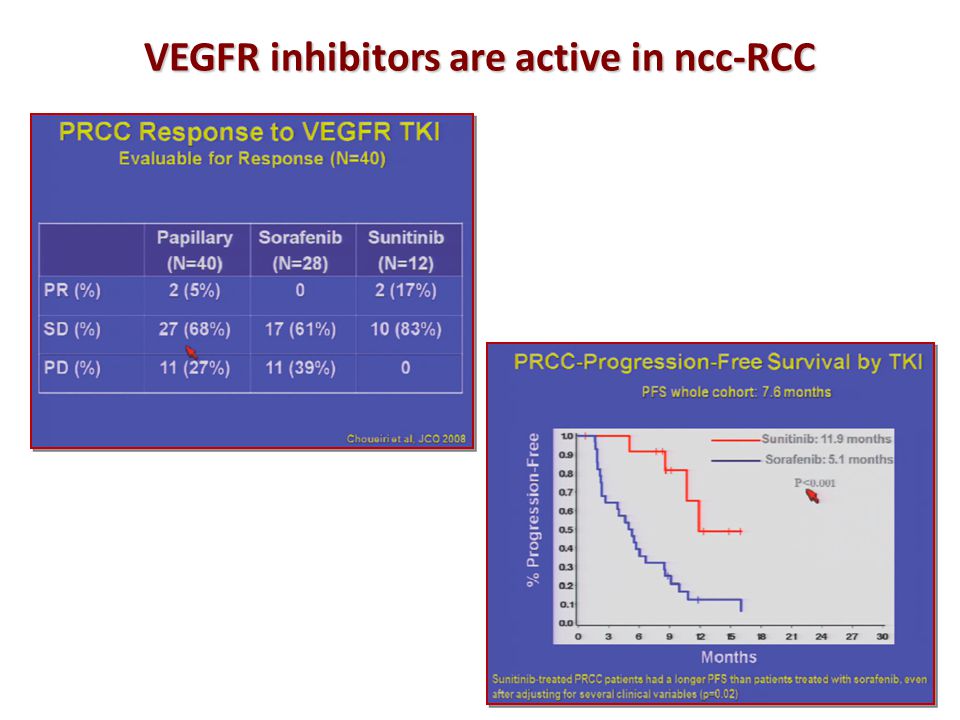
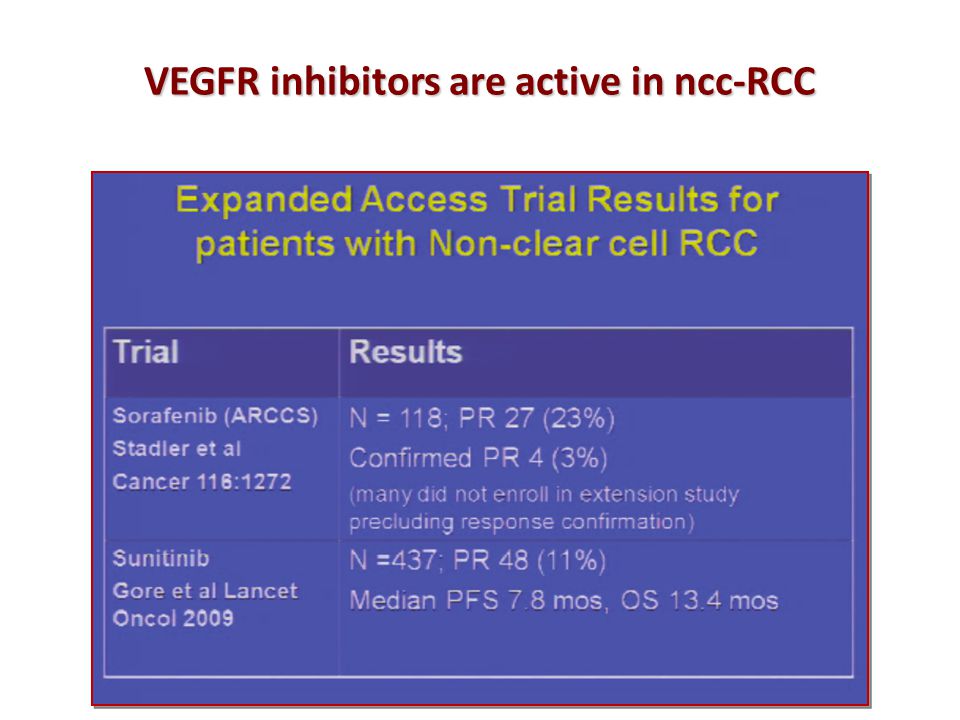
VEGFR inhibitors are active in ncc-RCC

42
…but are still less active than in cc-RCC!!! Modified from: Heng, JCO 2009

43
Overall Survival by Histologic Subtype (ITT Population) Data on file, Wyeth Pharmaceuticals Inc. Variable IFNTORISELP NOS 1 (CI) 2 NOS (CI)HR ITT Population 207 7.3 (6.1-8.8) 209 10.9 (8.6-12.7) 0.780.0252 Histologic subtype Clear cell170 8.2 (6.6-10.4) 169 10.6 (8.5-13.0) 0.850.1304 Other36 4.3 (3.2-7.3) 37 11.6 (8.9-15.0) 0.550.0095 1 Median Overall Survival in months 2 95% Confidence Interval
 2 NOS (CI)HR ITT Population ( ) ( ) Histologic subtype Clear cell ( ) ( ) Other ( ) ( ) Median Overall Survival in months 2 95% Confidence Interval.")
44
Tem vs IFN in ncc-RCC Dutcher, Med Oncol 2009

45
Tem vs IFN in ncc-RCC Dutcher, Med Oncol 2009

46
And don’t forget other things maybe important too…

48
Armstrong, JCO 2012 Low LDH High LDH IFN Tem LDH levels are predictive of Tem benefit over IFN in poor risk mRCC patients

49
…still a peculiarity of mTOR inhibitors? Modified from Heng, JCO 2009

50
Conclusions Temsirolimus is the most appropriate therapeutic choice in the vast majority of pts w at least 3/6 poor risk features (and, by the way, the only one supported by evidence….) Temsirolimus is the most appropriate therapeutic choice in the vast majority of pts w at least 3/6 poor risk features (and, by the way, the only one supported by evidence….) In selected pts w intermediate risk by strict MSKCC criteria, Sunitinib is a reasonable choice In selected pts w intermediate risk by strict MSKCC criteria, Sunitinib is a reasonable choice However, in a fraction of poor risk pts VEGF inhibitors dramatically alter disease natural history (…but how do we identify them???) However, in a fraction of poor risk pts VEGF inhibitors dramatically alter disease natural history (…but how do we identify them???) Other factors, such as nefrectomy status, histology, LDH levels, or the necessity to obtain an objective response should be taken into account Other factors, such as nefrectomy status, histology, LDH levels, or the necessity to obtain an objective response should be taken into account
 Temsirolimus is the most appropriate therapeutic choice in the vast majority of pts w at least 3/6 poor risk features (and, by the way, the only one supported by evidence….) In selected pts w intermediate risk by strict MSKCC criteria, Sunitinib is a reasonable choice In selected pts w intermediate risk by strict MSKCC criteria, Sunitinib is a reasonable choice However, in a fraction of poor risk pts VEGF inhibitors dramatically alter disease natural history (…but how do we identify them ) However, in a fraction of poor risk pts VEGF inhibitors dramatically alter disease natural history (…but how do we identify them ) Other factors, such as nefrectomy status, histology, LDH levels, or the necessity to obtain an objective response should be taken into account Other factors, such as nefrectomy status, histology, LDH levels, or the necessity to obtain an objective response should be taken into account")
51
Open questions How will new prognostic classifications impact on these results? How will new prognostic classifications impact on these results? Is there a life after first-line for poor risk patients? Is there a life after first-line for poor risk patients? Will we ever understand the biology behind clinical classifications (if there is any…)? Will we ever understand the biology behind clinical classifications (if there is any…)?
. Will we ever understand the biology behind clinical classifications (if there is any…) .")
Similar presentations


 vs FOLFIRI plus bev>")

 on the Efficacy.>")


 study.>")
