Download presentation
Presentation is loading. Please wait.

1
Tompkins Workforce Investment Board Dashboard March 2015

2
Key Goals Increase the number of work-ready, basic-skilled workers Retain and attract more young adults Prepare for the wave of baby-boomer retirements Facilitate and enable the recruitment of workers for specialized occupations Reduce underemployment and its accompanying underuse of talent Increase the workforce system’s capacity to manage near-term challenges and opportunities

3
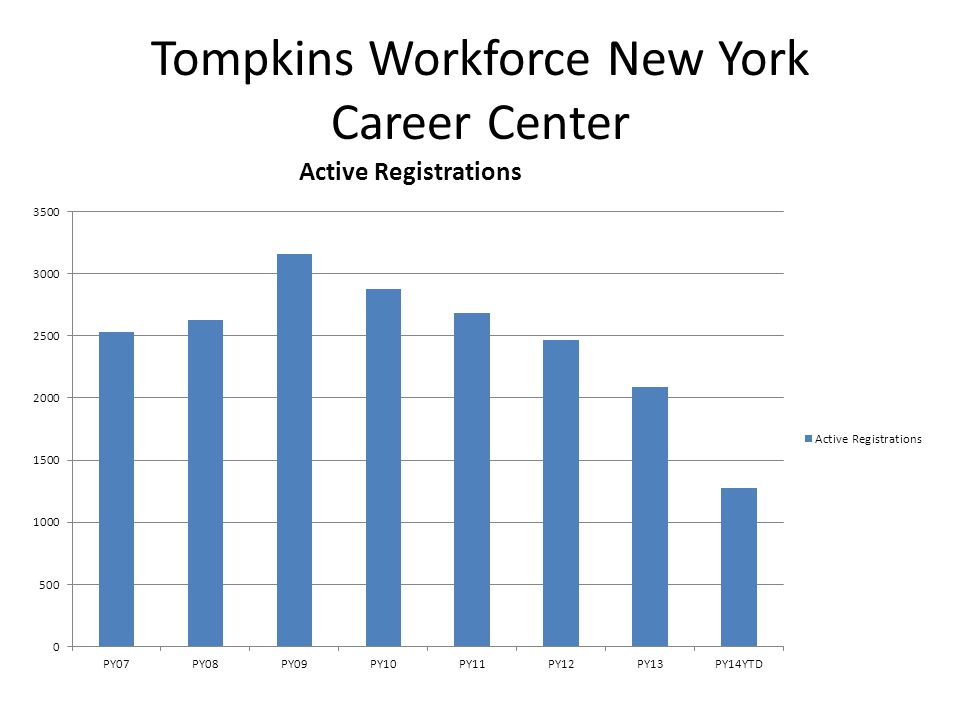
Tompkins Workforce New York Career Center

5
UNEMPLOYMENT RATE

6
Both Labor Participation and Unemployment Rate Down=Less People Available for Work

7
Student Jobs Are Excluded

8
Ad-Hoc Snapshot in Tompkins County, New York CurrentHistoricalForecast Four Quarters Ending with 2014q3 Total Change over the Last 5 Years Average Annual % Change in Employment 2009q3-2014q3Over the Next 3 Years NAICSIndustryEmployment Avg. Annual WagesEmployment Tompkins County, New YorkNew YorkUSA Total Approx Repl Demand Total Growth Demand Avg. Annual Growth Percent 61Educational Services18,274$49,340-1,208-1.3%0.1%0.0%1,1523390.6% 62Health Care and Social Assistance6,239$41,4992891.0%1.4%2.2%3673311.7% 54Professional, Scientific, and Technical Services2,105$61,791-29-0.3%1.8% 133891.4% 23Construction954$43,356641.4%-0.1%-0.8%58652.2% 56 Administrative and Support and Waste Management and Remediation Services802$27,0872126.3%2.2%3.1%55281.2% 72Accommodation and Food Services3,766$17,7991720.9%4.1%2.2%395220.2% 81Other Services (except Public Administration)1,460$24,6921241.8%1.3%-1.1%110220.5% 71Arts, Entertainment, and Recreation687$27,465-80-2.2%1.9%1.1%63120.6% 53Real Estate and Rental and Leasing639$37,079-12-0.4%0.1%0.2%4370.4% 21Mining, Quarrying, and Oil and Gas Extraction251$62,776-31-2.3%-1.8%4.6%1860.8% Sorted by Growth Demand
1,460$24, %1.3%-1.1% % 71Arts, Entertainment, and Recreation687$27, %1.9%1.1% % 53Real Estate and Rental and Leasing639$37, %0.1%0.2%4370.4% 21Mining, Quarrying, and Oil and Gas Extraction251$62, %-1.8%4.6%1860.8% Sorted by Growth Demand.")
9
Ad-Hoc Snapshot in Tompkins County, New York CurrentHistoricalForecast Four Quarters Ending with 2014q3 Total Change over the Last 5 Years Average Annual % Change in Employment 2009q3- 2014q3Over the Next 3 Years NAICSIndustryEmployment Avg. Annual Wages Location QuotientEmployment Tompkins County, New YorkNew YorkUSA Total Approx Repl Demand Total Growth Demand Avg. Annual Growth Percent 61Educational Services18,274$49,3404.13-1,208-1.3%0.1%0.0%1,1523390.6% 44Retail Trade4,961$24,7930.89540.2%1.5%0.8%459-16-0.1% 72Accommodation and Food Services3,766$17,7990.831720.9%4.1%2.2%395220.2% 62Health Care and Social Assistance6,239$41,4990.872891.0%1.4%2.2%3673311.7% 31Manufacturing3,343$62,8260.761751.1%-1.7%-0.2%230-98-1.0% 92Public Administration2,109$46,3980.80-79-0.7%-1.4%-0.7%151-53-0.8% 54Professional, Scientific, and Technical Services2,105$61,7910.69-29-0.3%1.8% 133891.4% 81Other Services (except Public Administration)1,460$24,6920.951241.8%1.3%-1.1%110220.5% 52Finance and Insurance1,063$64,1030.52-6-0.1%-0.5%-0.2%75-3-0.1% 48Transportation and Warehousing895$37,2380.47-51-1.1%-0.4%0.6%71-6-0.2% Sorted by Replacement Demand
1,460$24, %1.3%-1.1% % 52Finance and Insurance1,063$64, %-0.5%-0.2% % 48Transportation and Warehousing895$37, %-0.4%0.6% % Sorted by Replacement Demand.")
Similar presentations


 Industry Employment Projection Report: 2010-2020 EmploymentProjected Change.>")


 2004 - 2009 ImprovingLeading LaggingSlipping Source: Oklahoma.>")


739-4206 - L. Jay Burks What is a NAICS Code The North American Industry Classification System (NAICS)>")


>")


