Download presentation
Presentation is loading. Please wait.

1
Geographic Information Systems (GIS) Dr. Roy Cole Department of geography and Planning GVSU
 Dr. Roy Cole Department of geography and Planning GVSU")
2
What is a geographic information system? A computer system designed for storing, manipulating, analyzing, and displaying data in a geographic context. a computer system designed to allow users to collect, manage and analyze large volumes of spatially referenced information and associated attribute data. Analysis that combine relational databases with spatial interpretation and outputs often in form of maps. A GIS represents within a computer real-world geographic relationships and allows them to be analyzed and modeled.

3
Topology is at the heart of GIS analysis The geometric characteristics of objects which do not change under transformations (stretching or bending) and are independent of any coordinate system. The topological characteristics of an object are also independent of scale of measurement. Topology as it relates to spatial data consists of three elements: Adjacency. Containment. Connectivity. In GIS, distance, area, volume can be measured. Almost anything can be mapped.

4
Questions that can be answered with a GIS What is there? How much is there? Why isn’t it elsewhere? Was it there in the past? Will it be there in the future?

5
GIS research can be basic or applied Basic research. Modeling land use change. Spread of a disease through a population. Impact of global climate change on agriculture. Determining an endangered species’ habitat. The ideal location of health centers to equally provide service to all people in a country or region. Modeling urban growth. Previous geographic states: pre-crustal (isostatic) rebound Michigan.
 rebound Michigan..")
6
GIS research can be basic or applied Applied research. Environmental protection/restoration. Pollution mapping and modeling. Crime mapping. Natural resource management. Power allocation by utilities companies. Most efficient routing for vehicles. Marketing areas. Surveillance of disease outbreak and spread. Planning urban growth. Facilities (gas lines, fire hydrants, etc.) management. County and city property taxation.
 management. County and city property taxation..")
7
Two principal types of GIS, raster and vector Raster GIS. Raster representations divide the world into arrays of cells. Geographic unit of raster GIS. The cell (pixel). A unique reference coordinate represents each pixel either at a corner or the centroid. Attributes (variables) are assigned to the cells.
. A unique reference coordinate represents each pixel either at a corner or the centroid. Attributes (variables) are assigned to the cells..")
8
Two principal types of GIS, raster and vector Vector GIS. Displays and defines features on the basis of two-dimensional Cartesian coordinate pairs (x and y) and computational algorithms of the coordinates. Geographic elements in vector GIS: Point = node. Line = vertex or arc. Area = polygon. Each element can be given attributes. Location. Adjacency. Variables.
 and computational algorithms of the coordinates. Geographic elements in vector GIS: Point = node. Line = vertex or arc. Area = polygon. Each element can be given attributes. Location. Adjacency. Variables..")
9
Two types of GIS data, attribute and spatial Attribute data. A characteristic of a feature that contains a measurement or value for the feature. The variable being measured. An item for which data are collected and organized. Labels. Categories. Numbers. Dates. Standardized values. Field or other measurements. Can be at any level of measurement. Nominal. Ordinal. Interval/ratio.

10
Two types of GIS data, attribute and spatial Spatial data. Geographical location. Where the variable being measured is located. Points. Lines. Polygons. Pixels.

11
Comparison of raster and vector MethodAdvantagesDisadvantages Raster Simple data structureRequires greater storage space on computer Compatible with remotely sensed or scanned data Depending on pixel size, graphical output may be blocky and “unmaplike” Simple spatial analysis proceduresProjection transformations are more difficult More difficult to represent topological relationships Vector Requires less disk storage spaceMore complex data structure Topological relationships are readily maintainedNot as compatible with remotely sensed data Graphical output more closely resembles hand- drawn mapsSoftware and hardware are often more expensive Some spatial analysis procedures may be more difficult Overlaying multiple vector maps is often time consuming

12
Examples How many people live within 10 miles of a superfund site in Michigan? Sales by market region by sales agent. Population change in any state over time. Spread of soybean cultivation across the United States. What is the best place to site the Grand Haven bypass? Prolonged drought and land use change over a 33-year period in central Mali, West Africa. Does living next to light rail public transportation increase the value of property? Where are the pediatricians who are chosen by women who give birth at North Ottawa Community Hospital located: Grand Haven or elsewhere?

13
Change in soybean production in Michigan, 1952 to 2002

14
Diffusion of Soybean Cultivation, 1927 to 2005

15
GIS is useful to understand land use change in West Africa

17
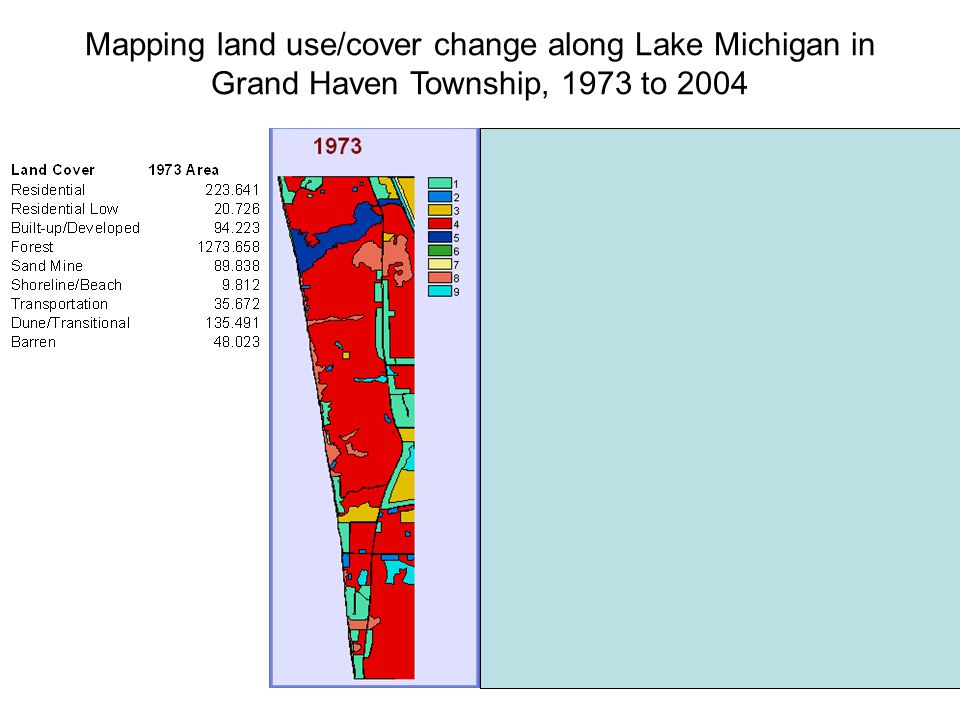
Mapping land use/cover change along Lake Michigan in Grand Haven Township, 1973 to 2004

19
Mapping crime Identifying priority neighborhoods (Vulnerable Localities Index). Geographical indicators of community cohesion. Crime hotspots. Profiling hot spots. Predicting patterns of criminal activity.

20
Crime mapping, Tifton, Georgia Beginning in 2004, the South Georgia Regional Development Center began geocoding crime incidents for Tifton, Georgia (population 15,000). Officials wanted to see how the crime patterns would look. Initially, a density map for all Part I crimes for the period of February 2004– April 2004 was made. After that, crimes were broken down by six-hour time periods (midnight to 6:00 a.m., 6:00 a.m. to noon, noon to 6:00 p.m., 6:00 p.m. to midnight) to see how density patterns would vary by time of day. Analyzing crime incidents by time of day helps law enforcement concentrate patrol efforts during specific time periods.
 to see how density patterns would vary by time of day. Analyzing crime incidents by time of day helps law enforcement concentrate patrol efforts during specific time periods..")
Similar presentations


? A GIS is a particular form of Information System applied to geographical.>")


