Download presentation
Presentation is loading. Please wait.

1
Global Mapping of Impervious Surface Area Benjamin Tuttle* - CIRES, University of Colorado, Boulder Christopher D Elvidge, PhD - NOAA-National Geophysical Data Center Kim Baugh - CIRES, University of Colorado, Boulder Ramakrishna Nemani, PhD - NASA Ames Research Center, Moffett Field, California, USA Cristina Milesi, PhD - Division of Science and Environmental Policy, California State University, Monterey Bay, California USA Paul Sutton, PhD - University of Denver

2
► Although exact numbers are elusive, there is a general consensus that in the past 30 years the world's population has had the highest absolute increase in human history. ► It is agreed that more and more of the world population will live in urbanized areas leading to increases in impervious surfaces world wide.

3
Ecological Disturbance ► Construction of transportation infrastructure and buildings can be viewed as an ecological disturbance. ► However, impervious surfaces are resistant to decay and often actively maintained. ► This means a slowed ecological recovery or succession.

4
Impacts of Impervious Surfaces ► Increased runoff of precipitation -Alters hydrology by moving water quickly into drainages ► Displace vegetation -Fragments vegetation cover and reduces transpiration ► Absorb sunlight without transpiration -Urban heat islands

5
Uses for Impervious Surface Products ► Climate Models ► Hydrologic Models – flood predictions, definition of flood plains, sizing of sewer systems to avoid overflow. ► Analysis of impervious surface area on water quality and morphological changes in stream channels and wetlands. ► Studies of human impact on biodiversity, habitat loss, and habitat fragmentation Elvidge, C.D., C. Milesi, J.B. Dietz, B.T. Tuttle, P.C. Sutton, R. Nemani, J.E. Vogelmann, 2004: U.S. constructed area approaches the size of Ohio. EOS, Trans. Am. Geophys. Un.: Vol. 85, 233-233 Milesi C, SW Running, CD Elvidge, JB Dietz, BT Tuttle, RR Nemani, 2005: Mapping and modeling the biogeochemical cycling of turf grasses in the United States. Environmental Management : Vol. 36 (3), 426-438 Milesi, C., C.D. Elvidge, R.R. Nemani, and S.W. Running, 2003: Assessing the impact of urban land development on net primary productivity in the Southeastern United States, Rem. Sens. Environ.: Vol. 86, 401– 410.
, Milesi, C., C.D. Elvidge, R.R. Nemani, and S.W. Running, 2003: Assessing the impact of urban land development on net primary productivity in the Southeastern United States, Rem. Sens. Environ.: Vol. 86, 401–")
6
► Increases in impervious surface area (ISA) have a wide spread impact on our environment. Impacts on hydrology Impacts on temperature Impacts on the carbon cycle

7
► In order to better understand these impacts we need maps of ISA. ► Direct measurement of ISA requires high spatial resolution imagery. ► Typically maps of ISA are made from high resolution imagery for small areas. ► There is a need for continental and global maps of ISA.

8
Mapping ISA Globally ► One km 2 spatial resolution ► Three data sets used: Radiance Calibrated Nighttime Lights from DMSP-OLS Landscan Population USGS MRLC ISA

9
Radiance Calibrated Nighttime Lights Created from a composite of cloud-free fixed gain imagery and converted to radiance.

10
Landscan Population Census counts (at sub-national level) were apportioned to each grid cell based on likelihood coefficients, which are based on proximity to roads, slope, land cover, and other information. LandScan has been developed as part of the Oak Ridge National Laboratory (ORNL)Oak Ridge National Laboratory (ORNL) Global Population Project for estimating ambient populations at risk.
Oak Ridge National Laboratory (ORNL) Global Population Project for estimating ambient populations at risk..")
11
USGS MRLC ISA

12
-Created from 30m Landsat -Impervious surfaces were extracted using a regression tree model.

13
Radiance Calibrated Nighttime Lights

14
Landscan Population

15
Results ► Radiance Calibrated Nighttime Lights and Landscan Population were found to be good predictors of ISA. ► While other predictors were examined, they were not found to be as well correlated.

16
Results %ISA = (0.0747403*Radiance + 0.0046079*Landscan) 0.0046079*Landscan) R2 = 0.6897
 *Landscan) R2 =")
17
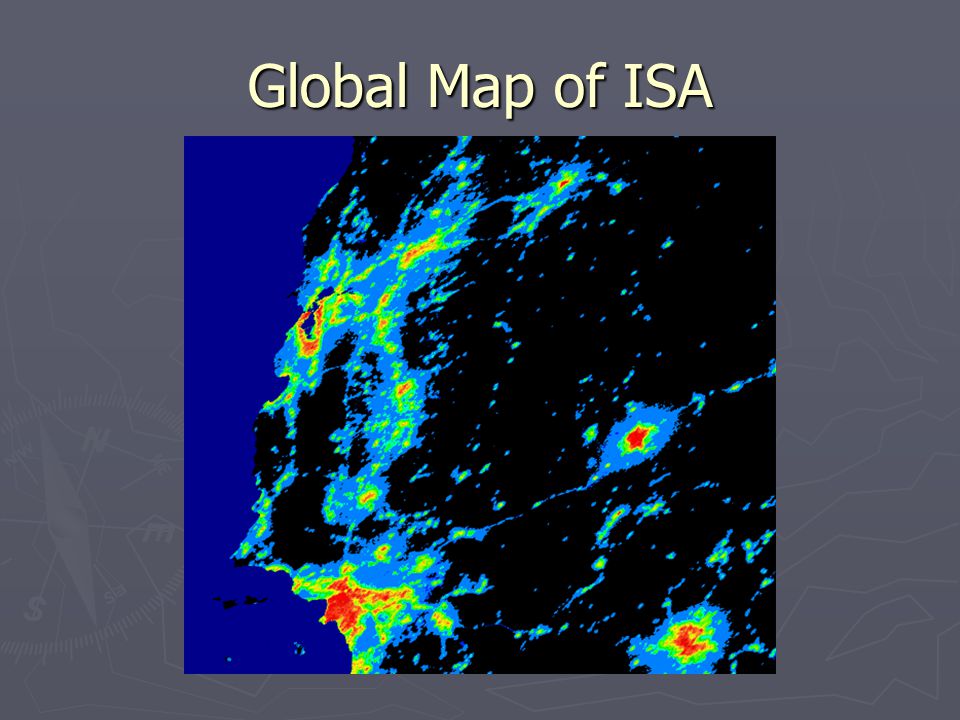
Global Map of ISA

19
Questions? Download the Data: http://www.ngdc.noaa.gov/dmsp/

Similar presentations


>")

: BASIC FACTS & GEO WG GEO WORK PLAN SYMPOSIUM 2015 5-7 May 2015, WMO Building, Salle Obasi 7bis avenue de la Paix,>")


 Why watersheds? ERS 482/682 Small Watershed Hydrology.>")

