Download presentation
Presentation is loading. Please wait.

1
IAGA: AUGUST, 2013, Merida, Mexico, PAPER J7-11 LARGE MESOPAUSE BRIGHTNESS EVENTS, OBSERVATIONS AND EXPLANATIONS Bright, wall, or large amplitude planar wave events in airglow Very bright, single planar event (but period 1.5-7 hours, same as a medium scale gravity wave present with the same intrinsic phase speed, and horizontal alignment as the the medium scale gw present) Leading dark (cooling) followed by sharp brightening (warming) A large amplitude wave, or a large instability overturning event (billow) (note, the instability ‘surfs’ on the medium scale wave) Gary Swenson 1, Alan Liu 2, Mike Taylor 3, Dominique Pautet 3, Fabio Vargas 1, Tony Mangognia 1 1: University of Illinois 2: Embry Riddle University 3: Utah State University
 Leading dark (cooling) followed by sharp brightening (warming) A large amplitude wave, or a large instability overturning event (billow) (note, the instability ‘surfs’ on the medium scale wave) Gary Swenson 1, Alan Liu 2, Mike Taylor 3, Dominique Pautet 3, Fabio Vargas 1, Tony Mangognia 1 1: University of Illinois 2: Embry Riddle University 3: Utah State University")
2
Waves (AGWs) and Airglow Response WAVE Examples Aug 9, 1993 (ALOHA, Aircraft, Swenson and Espy) and August 10, 93 (ALOHA-Taylor et al.)* Aug 12, 2004, Li et al., 2005 (Maui, 22 o N)* Others observed by lidar, Maui Jan 24, 2012 (Cerro Pachon, Chile, 30 o S) Summary Large amplitude, medium scale gravity wave coupling with a large amplitude tide, for a single planar wave. Both Convective and Shear Instabilities Result

3
OH O 2 (b) O ( 1 S) Fig. 4 Vargas et al., 2007. Mesospheric Airglow Layers
 O ( 1 S) Fig. 4 Vargas et al., Mesospheric Airglow Layers")
4
Mesosphere, Lower Thermosphere Remote Sensing Instrumentation Andes Lidar Observatory (ALO) (Cerro Pachon, Chile, 30 o S) Na Doppler Lidar (U of I; Liu,ERAU) OH Temperature Mapper (Taylor, USU) Meteor Radar (Franke, U of I) OH, 90 o imager, 1.6μ (Hecht, Aerospace) OH, Na, O 2, O( 1 S) Allsky Imager (U of I) Multi-Channel Photometer, Zenith, OH, O 2, O( 1 S), BG (Mangognia, U of I)
 (Cerro Pachon, Chile, 30 o S) Na Doppler Lidar (U of I; Liu,ERAU) OH Temperature Mapper (Taylor, USU) Meteor Radar (Franke, U of I) OH, 90 o imager, 1.6μ (Hecht, Aerospace) OH, Na, O 2, O( 1 S) Allsky Imager (U of I) Multi-Channel Photometer, Zenith, OH, O 2, O( 1 S), BG (Mangognia, U of I)")
5
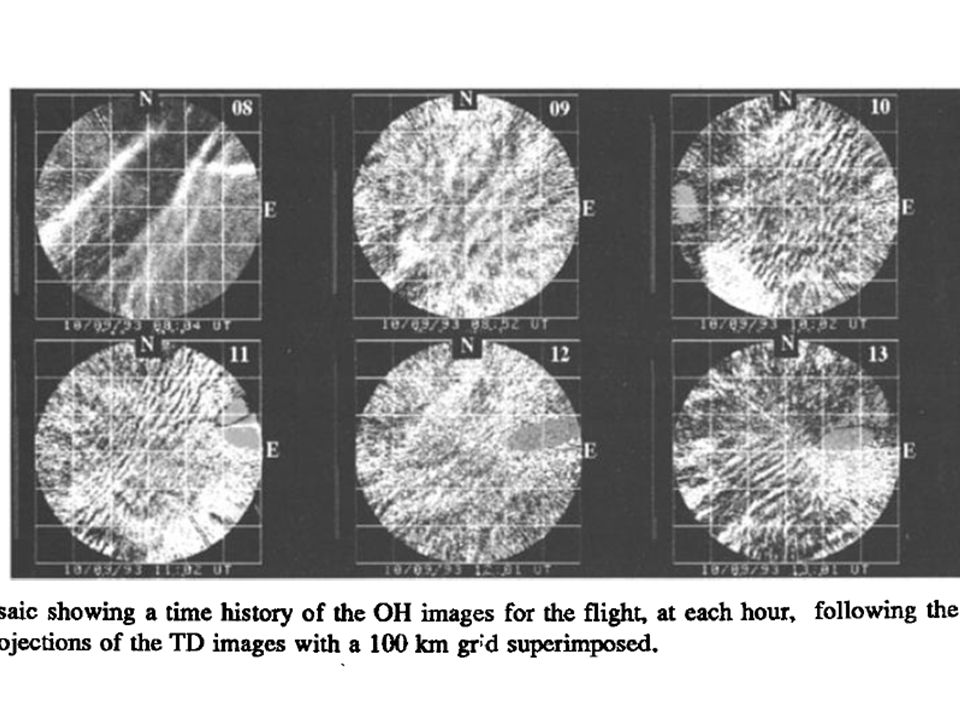
August 9, 93 (ALOHA, Aircraft, Swenson and Espy)
")
9
August 10, 93 (ALOHA-Taylor et al.)* Note: Direction of propagation, and event time of the ‘wall’ of airglow was ~23.5 hours after the Aug 9 event. O2O2 OH

10
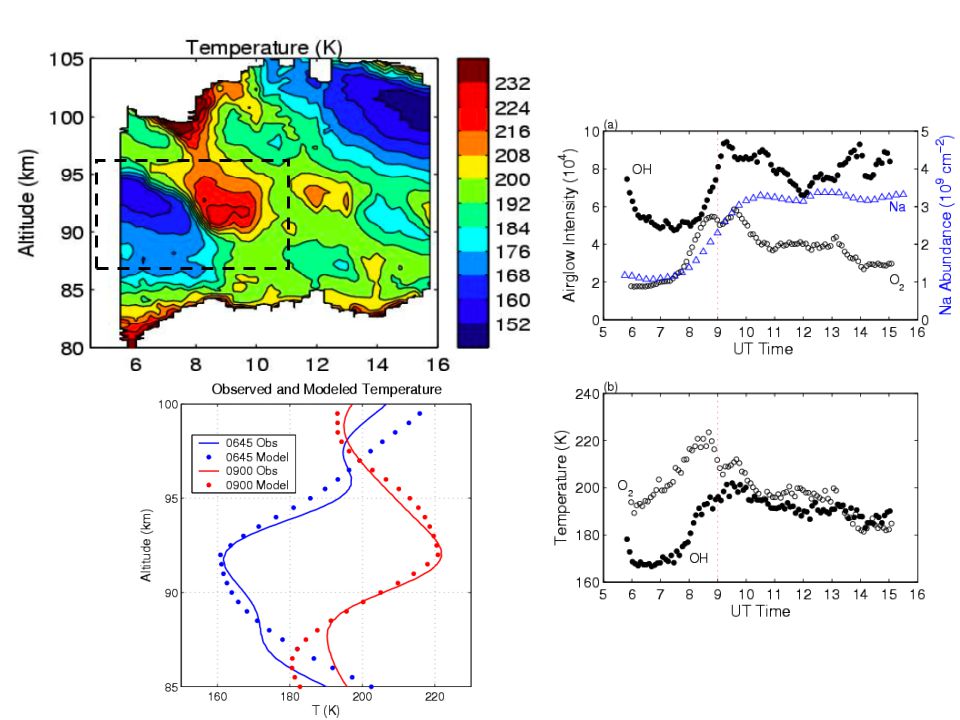
Analysis showed that this event was caused by a large- amplitude, upward-propagating gravity wave with a period of about 4–5 hours and a vertical wavelength of about 20 km, i.e., a ‘‘wall’’ wave. This wall wave induced dramatic changes in temperature (T’/T 30 K), airglow intensity (doubled in the OH and tripled in the O2 emissions), and Na abundance (tripled). Feng Li et al., Investigation of a ‘‘wall’’ wave event, JGR,2007 Li et al., 2005 (Maui)* (Zonal, propagated from West)
, airglow intensity (doubled in the OH and tripled in the O2 emissions), and Na abundance (tripled). Feng Li et al., Investigation of a ‘‘wall’’ wave event, JGR,2007 Li et al., 2005 (Maui)* (Zonal, propagated from West).")
13
Superadiabatic 80 90 100 Altitude (km) 150250 Temperature (K) Convective Instabilites Swenson et al., 1998 Dynamic Instabilites F. Li et al., 2005 Δt~45 min

14
. Large amplitude for 1 h h 300-1300 km, ~1.5-7 hours Trailing, phase front aligned, hf wave And Z Inversion, dT/dz = 0 LAW zone Large Amplitude Wave Cool--Warm Dim-Bright

15
Other Maui Waves

19
MCP data O( 1 S) OH λ x = 100 km λ z = 16 km Φ = 349 ° τ o = 132 min c o = 15 m/s (from NNW) 3 4 5 6 UT
 OH λ x = 100 km λ z = 16 km Φ = 349 ° τ o = 132 min c o = 15 m/s (from NNW) UT")
20
Temperature Mapper Keogram OH Temperature Bright Event N-S E-W 4 5 6 7 8 9 Time, UT 3 4 5 6 7 8

21
Summary 11/14 Event Winds, Z ~15 km,consistent with OH and O 1 S phase. 60 m/s phase speed, AGW ~6 hr wave; h = 1300 km Events--Common features: Z (and phase speeds)-Similar, 15-20 km. All source directions from NW or W* All events have downward phase progression below T inversion h varies-300 to 1300 km, + trailing SS waves All have one, large magnitude, ~1 h leading feature Upwelling then downwelling T, cold then warm; Airglow dim then bright Thickness of the ‘enhanced’ wave 4-8 km. 01/24/2012 Cerro Pachon Event, Forced instabilities, a surfing billow?
-Similar, km. All source directions from NW or W* All events have downward phase progression below T inversion h varies-300 to 1300 km, + trailing SS waves All have one, large magnitude, ~1 h leading feature Upwelling then downwelling T, cold then warm; Airglow dim then bright Thickness of the ‘enhanced’ wave 4-8 km. 01/24/2012 Cerro Pachon Event, Forced instabilities, a surfing billow .")
22
Wall Waves Spatial x=150-400 km, y= 1000’s km, z=5-10 km Temperature T, 30K cooling, followed by warming AGW couples with tide to force instability Large scale, well capable of bubble scale Observed in mesopause region (90-105 km) Predicted for next tidal VWL, i.e. 115-130 km In Northern Hemisphere, propagate from NW-SE Observe and study with ICON Readily observed along the phase front T profiles from 90-150 km Plot T separately from both FOV of Mighty

Similar presentations


![INTROTHE MODELTHE DATATHE COMPARISONOUTLOOK 1 Atmospheric waves workshop 9-10 November, 2011 ESTEC, Noordwijk (NL)E 2011 Manuela Sornig [1] RIU – Department.](/9/2375544/big_thumb.jpg "INTROTHE MODELTHE DATATHE COMPARISONOUTLOOK 1 Atmospheric waves workshop 9-10 November, 2011 ESTEC, Noordwijk (NL)E 2011 Manuela Sornig [1] RIU – Department.>")

: Global Estimates of Gravity Wave Momentum Flux from HIRDLS Observations. JGR 113 D15S18 Ern et al (2004): Absolute Values.>")

 the Arecibo Observatory Jonathan Friedman Arecibo Observatory 17 May.>")


>")


