Download presentation
Presentation is loading. Please wait.

1
Monitoring soil mineral nitrogen concentration in Germany: Preliminary results and some methodical challenges P. Schweigert* and R.R. van der Ploeg Institute of Soil Science, University of Hannover, Hannover, Germany

2
N surplus of agricultural land in Germany

3
Soil mineral nitrogen increased Consequences of N surplus

4
Soil mineral nitrogen increased Nitrate leaching increased Consequences of N surplus

5
Soil mineral nitrogen increased Nitrate leaching increased Nitrate concentration in groundwater often increased over 50 mg l -1 Problem for drinking water supliers, because: 50 mg l -1 is the upper limit in drinking water Consequences of N surplus

6
Soil mineral nitrogen increased Nitrate leaching increased Nitrate concentration in groundwater often increased over 50 mg l -1 Problem for drinking water supliers, because: 50 mg l -1 is the upper limit in drinking water 80 % of the drinking water comes from groundwater Consequences of N surplus

7
Prevention of overfertilization Promotion of cover crop cultivation during fall Measures to reduce nitrate leaching

8
In drinking water catchments Soil mineral nitrogen (NO 3 -N) in 0-90 cm depth In fall before leaching begins Result check: Monitoring programs
 in 0-90 cm depth In fall before leaching begins Result check: Monitoring programs")
9
Baden-Württemberg : - Since 1987 - First program in Germany - 60000 samples per year Result check: Monitoring programs

10
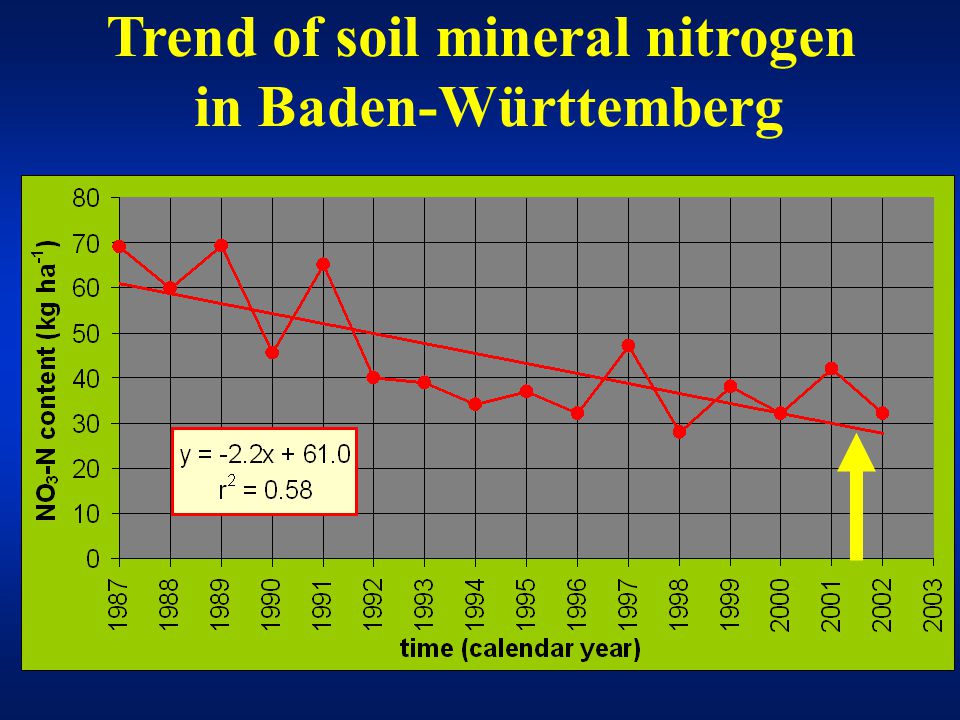
Trend of soil mineral nitrogen in Baden-Württemberg

13
Preliminary result - Soil nitrate concentration decreases - Nitrate leaching probably decreases

14
Are there still problems, that should be solved? Are there anyhow methodical challenges? Methodical challenges?

15
Trend of soil mineral nitrogen in Baden-Wuerttemberg

17
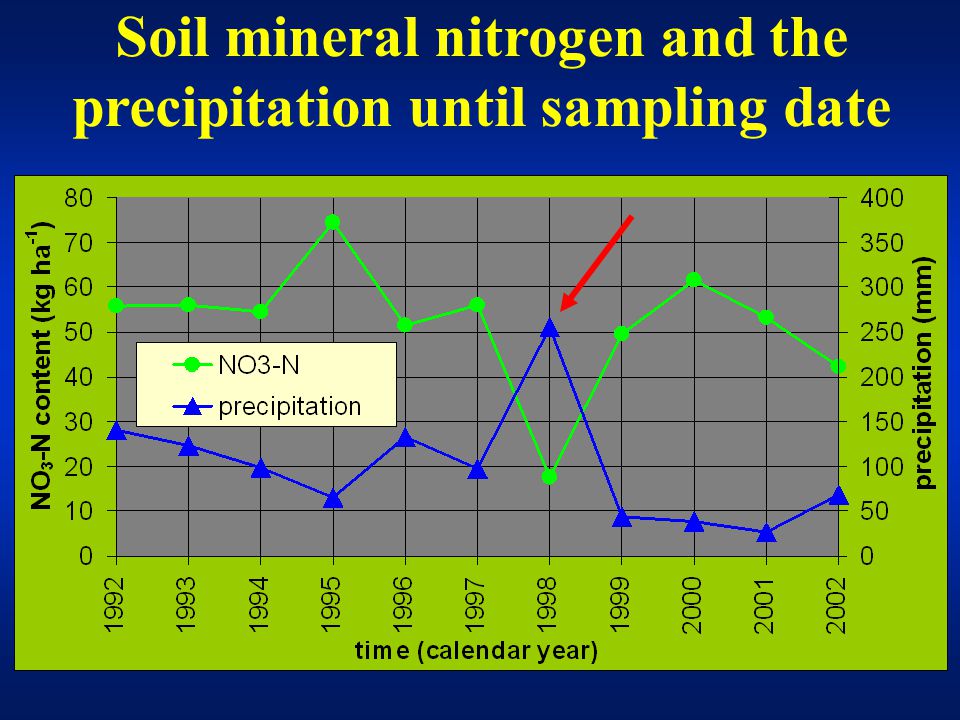
Quantification of the influences of the weather on the mineral N content of the soils Methodical challenge:

18
Result check: Monitoring programs Liebenau - Since 1992 - 100 samples per year

19
Soil mineral nitrogen in Liebenau

20
Soil mineral nitrogen and the precipitation until sampling date

25
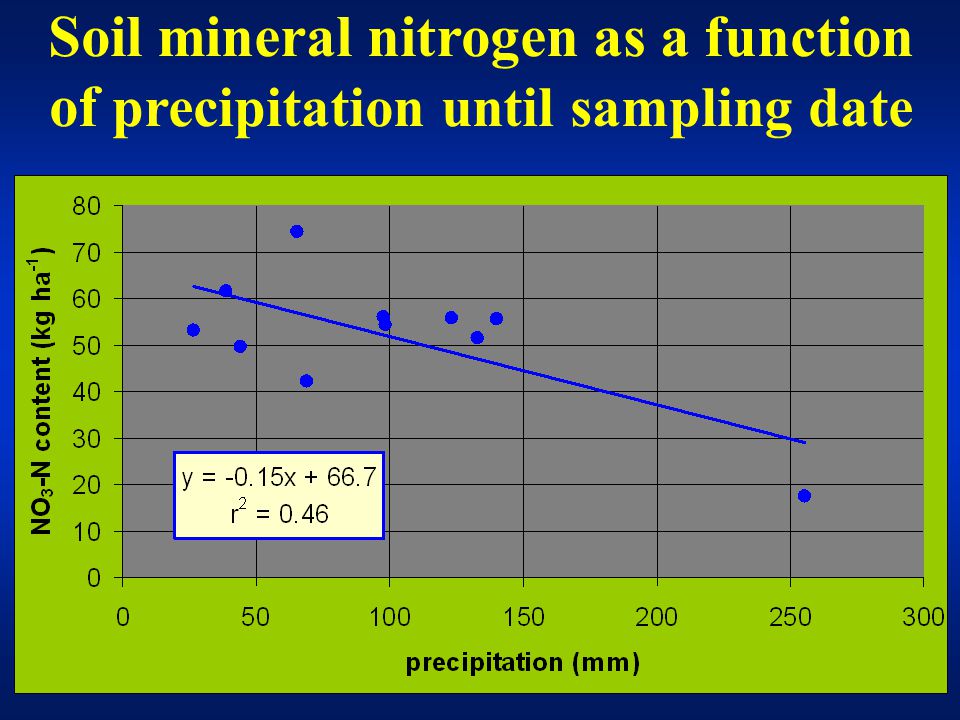
Soil mineral nitrogen as a function of precipitation until sampling date

27
Simple regression with 1 variable NO 3 -N = mean NO 3 -N fall content of all soils (kg ha -1 ), 0-90 cm depth P 10 = Precipitation since 1. October, until date of sampling (mm) NO 3 -N = - 0.15 P 10 + 66.7 r 2 = 0.46 *
 NO 3 -N = P r 2 = 0.46 *.")
31
Multiple regression with 2 variables NO 3 -N = mean NO 3 -N fall content of all soils (kg ha -1 ), 0-90 cm depth P 10 = Precipitation since 1. October, until date of sampling (mm) Y = Year (1992 = 0; 1993 = 1; 1994 = 2; etc.), temporal trend NO 3 -N = - 0.20 P 10 - 2.8 Y + 86.6 r r 2 = 0.86 ***
 Y = Year (1992 = 0; 1993 = 1; 1994 = 2; etc.), temporal trend NO 3 -N = P Y r r 2 = 0.86 ***.")
32
Multiple regression with 2 variables NO 3 -N = mean NO 3 -N fall content of all soils (kg ha -1 ), 0-90 cm depth P 10 = Precipitation since 1. October, until date of sampling (mm) Y = Year (1992 = 0; 1993 = 1; 1994 = 2; etc.), temporal trend NO 3 -N = - 0.20 P 10 - 2.8 Y + 86.6 r 2 = 0.86 ***
 Y = Year (1992 = 0; 1993 = 1; 1994 = 2; etc.), temporal trend NO 3 -N = P Y r 2 = 0.86 ***.")
34
Multiple regression with 4 variables NO 3 -N= mean NO 3 -N fall content of all soils (kg ha -1 ), 0-90 cm depth Y= Year (1992 = 0; 1993 = 1; 1994 = 2; etc.), temporal trend P 10 = Precipitation since 1. October until date of sampling (mm) P 9 = Precipitation of September (mm) T 10 = Mean air temperature at 2 p.m. in October (° C) NO 3 -N = - 0.17 P 10 - 3.2 Y - 0.08 P 9 + 3.1 T 10 + 52.3 r 2 = 0.97 ***
 P 9 = Precipitation of September (mm) T 10 = Mean air temperature at 2 p.m. in October (° C) NO 3 -N = P Y P T r 2 = 0.97 ***.")
35
Multiple regression with 4 variables NO 3 -N= mean NO 3 -N fall content of all soils (kg ha -1 ), 0-90 cm depth Y= Year (1992 = 0; 1993 = 1; 1994 = 2; etc.), temporal trend P 10 = Precipitation since 1. October until date of sampling (mm) P 9 = Precipitation of September (mm) T 10 = Mean air temperature at 2 p.m. in October (° C) NO 3 -N = - 0.17 P 10 - 3.2 Y - 0.08 P 9 + 3.1 T 10 + 52.3 r 2 = 0.97 ***
 P 9 = Precipitation of September (mm) T 10 = Mean air temperature at 2 p.m. in October (° C) NO 3 -N = P Y P T r 2 = 0.97 ***.")
36
Multiple regression with 4 variables NO 3 -N= mean NO 3 -N fall content of all soils (kg ha -1 ), 0-90 cm depth Y= Year (1992 = 0; 1993 = 1; 1994 = 2; etc.), temporal trend P 10 = Precipitation since 1. October until date of sampling (mm) P 9 = Precipitation of September (mm) T 10 = Mean air temperature at 2 p.m. in October (° C) NO 3 -N = - 0.17 P 10 - 3.2 Y - 0.08 P 9 + 3.1 T 10 + 52.3 r 2 = 0.97 ***
 P 9 = Precipitation of September (mm) T 10 = Mean air temperature at 2 p.m. in October (° C) NO 3 -N = P Y P T r 2 = 0.97 ***.")
38
Decrease of nitrate in groundwater

39
Preliminary results: - Measures to reduce the nitrate leaching are successful Conclusions

40
Methodical challenge: - Values of soil nitrate are superimposed by atmospheric influences Conclusions

41
Methodical challenge: - Values of soil nitrate are superimposed by atmospheric influences - Multiple regression models can detect these influences Conclusions

Similar presentations


. BIOGEOCHEMICAL CYCLES: A few general points (terrestrial systems): 1.Nutrient cycling is never perfect i.e. always.>")


