Download presentation
Presentation is loading. Please wait.

1
Glomerular Anatomy and Physiology
Renal Physiology 6 10/10/2011 Charles J. Foulks, M.D.

2
Fenestrations . (Endothelial cell surface layer)
FIG. 1. Schematic drawing of the glomerular barrier. Podo, podocytes; GBM, glomerular basement membrane; Endo, fenestrated endothelial cells; ESL, endothelial cell surface layer (often referred to as the glycocalyx). Arrows indicate the filtration of plasma fluid across the glomerular barrier, forming primary urine at a glomerular filtration rate (GFR) of 125 ml/min in humans. The plasma flow rate (Qp) is close to 700 ml/min, giving a filtration fraction of 20%. Also shown are the concentrations of albumin in serum (40 g/l) and estimated concentration in primary urine 4 mg/l (i.e., 0.1% of that in plasma). The sieving coefficient of albumin across the glomerular barrier in humans is estimated to be 10% of that in rodents. Haraldsson B et al. Physiol Rev 2008;88: ©2008 by American Physiological Society
. Arrows indicate the filtration of plasma fluid across the glomerular barrier, forming primary urine at a glomerular filtration rate (GFR) of 125 ml/min in humans. The plasma flow rate (Qp) is close to 700 ml/min, giving a filtration fraction of 20%. Also shown are the concentrations of albumin in serum (40 g/l) and estimated concentration in primary urine 4 mg/l (i.e., 0.1% of that in plasma). The sieving coefficient of albumin across the glomerular barrier in humans is estimated to be 10% of that in rodents. Haraldsson B et al. Physiol Rev 2008;88: ©2008 by American Physiological Society.")
3
Fenestrated endothelium
. Fenestrated endothelium FIG. 2. Scanning electron micrograph showing a mouse glomerulus (A) with several capillary loops, capillary lumen, and podocytes with their foot processes. To the right (B) is a fenestrated glomerular capillary with its fenestrated endothelium surrounded by podocyte foot processes. Scale bars: 10 µm (A) and 1 µm (B). Podocyte foot processes Haraldsson B et al. Physiol Rev 2008;88: ©2008 by American Physiological Society
 with several capillary loops, capillary lumen, and podocytes with their foot processes. To the right (B) is a fenestrated glomerular capillary with its fenestrated endothelium surrounded by podocyte foot processes. Scale bars: 10 µm (A) and 1 µm (B). Podocyte foot processes. Haraldsson B et al. Physiol Rev 2008;88: ©2008 by American Physiological Society.")
4
Cupromeronic Blue (charged) Lanthanum
. Fenestrations FIG. 4. Electron micrographs showing the glomerular barrier, with the capillary lumen above and the urinary space below. The endothelial cell surface coat (ESL) can be visualized with different techniques (121). A: Cupromeronic Blue was used to visualize the charged structures of the barrier. With this technique, the GBM appears to have a homogeneous structure. B: staining with lanthanum results in higher contrast and shows "bushlike" structures in the fenestrate that extend into the capillary lumen. Scale bars: 100 nm. Cupromeronic Blue (charged) Lanthanum Haraldsson B et al. Physiol Rev 2008;88: ©2008 by American Physiological Society
 can be visualized with different techniques (121). A: Cupromeronic Blue was used to visualize the charged structures of the barrier. With this technique, the GBM appears to have a homogeneous structure. B: staining with lanthanum results in higher contrast and shows bushlike structures in the fenestrate that extend into the capillary lumen. Scale bars: 100 nm. Cupromeronic Blue (charged) Lanthanum. Haraldsson B et al. Physiol Rev 2008;88: ©2008 by American Physiological Society.")
5
In steady state production/removal
. In steady state production/removal FIG. 5. Schematic drawing of the glomerular barrier with components of the glomerular endothelium [e.g., the integrins, Tie2, VEGF receptor 1 (VEGFR1), VEGFR2] and the endothelial cell surface coat (ESL). Several, or all, of the components of the ESL are produced by the endothelium at certain rates and removed to blood or urine at similar rates during steady-state conditions. Membrane-bound proteoglycans (PG), such as syndecan and glypican, which carry chondroitin sulfate (CS) side chains (syndecan) and/or heparan sulfate (HS) side chains (glypican and syndecan) form the glycocalyx. The ESL is formed by secreted proteoglycans such as perlecan (mainly HS) and versican (mainly CS) together with secreted glycosaminoglycans (GAG) (e.g., hyaluronan) and adsorbed plasma proteins (e.g., albumin and orosomucoid). Several other macromolecules not shown in the figure are important components of the ESL and the glycocalyx. The podocytes produce substances such as ang1 and VEGF that affect the endothelial cells. In steady state production/removal Produced by podocytes and influence endothelial cells Haraldsson B et al. Physiol Rev 2008;88: ©2008 by American Physiological Society
, VEGFR2] and the endothelial cell surface coat (ESL). Several, or all, of the components of the ESL are produced by the endothelium at certain rates and removed to blood or urine at similar rates during steady-state conditions. Membrane-bound proteoglycans (PG), such as syndecan and glypican, which carry chondroitin sulfate (CS) side chains (syndecan) and/or heparan sulfate (HS) side chains (glypican and syndecan) form the glycocalyx. The ESL is formed by secreted proteoglycans such as perlecan (mainly HS) and versican (mainly CS) together with secreted glycosaminoglycans (GAG) (e.g., hyaluronan) and adsorbed plasma proteins (e.g., albumin and orosomucoid). Several other macromolecules not shown in the figure are important components of the ESL and the glycocalyx. The podocytes produce substances such as ang1 and VEGF that affect the endothelial cells. In steady state production/removal. Produced by podocytes and. influence endothelial cells. Haraldsson B et al. Physiol Rev 2008;88: ©2008 by American Physiological Society.")
6
Cultured human podocytes Actin filaments
FIG. 6. Human podocytes in culture. A: image obtained by light microscopy shows small buds of foot processes beginning to form (white arrows). B: actin filaments stained by phalloidin. Foot process buds: white arrows
. B: actin filaments stained by phalloidin. Foot process buds: white arrows.")
7
Endothelial cell-specific antigen stain
. Endothelial cell-specific antigen stain Normal endothelial cell culture FIG. 7. Human glomerular endothelial cells in primary culture. A: light microscopic image of normal cells. B: cells labeled with Dil-Ac-LDL, an endothelial cell-specific agent. C: cells labeled with an endothelial cell-specific lectin from Ulex europaeus agglutinin I. Lectins are proteins with specific carbohydrate moieties that can bind to cells. A lectin from Dolichos biflorus is used to identify cells that belong to the A1 blood group. A lectin from Ulex europaeus is used to identify the H blood group antigen. A lectin from Vicia graminea is used to identify the N blood group antigen. Endothelial cell specific lectin stain Haraldsson B et al. Physiol Rev 2008;88: ©2008 by American Physiological Society

8
Human podocyte culture
. Perlecan (green) and actin are labeled red using phalloidin Perlecan antibody stain FIG. 8. Glomerular cells produce various proteoglycans. These images are from human podocytes in culture. A: production of perlecan, labeled green with specific antibodies. B: perlecan (green) and actin are labeled red using phalloidin. Proteoglycans are proteins[1] that are heavily glycosylated. The basic proteoglycan unit consists of a "core protein" with one or more covalently attached glycosaminoglycan (GAG) chain(s).[2] The chains are long, linear carbohydrate polymers that are negatively charged under physiological conditions, due to the occurrence of sulfate and uronic acid groups. Proteoglycans occur in the connective tissue. Haraldsson B et al. Physiol Rev 2008;88: ©2008 by American Physiological Society
 and. actin are labeled red. using phalloidin. Perlecan antibody stain. FIG. 8. Glomerular cells produce various proteoglycans. These images are from human podocytes in culture. A: production of perlecan, labeled green with specific antibodies. B: perlecan (green) and actin are labeled red using phalloidin. Proteoglycans are proteins[1] that are heavily glycosylated. The basic proteoglycan unit consists of a core protein with one or more covalently attached glycosaminoglycan (GAG) chain(s).[2] The chains are long, linear carbohydrate polymers that are negatively charged under physiological conditions, due to the occurrence of sulfate and uronic acid groups. Proteoglycans occur in the connective tissue. Haraldsson B et al. Physiol Rev 2008;88: ©2008 by American Physiological Society.")
9
Albumin Sieving Coefficient
Properties of the Glomerular Barrier and Mechanisms of Proteinuria TABLE 1.Reported sieving coefficients for albumin in studies with "controlled" tubular modification Species Albumin Sieving Coefficient Technique Reference Nos. Rat In vivo + lysine 310 Tissue uptake 179 18 Micropuncture 317 Humans, Fanconi Urine proteomics 208 0.0015 cIPK 123, 213, 214, 301, 302 Mouse 0.0023 134 0.0029 19 0.0080 IPK no tubular cell inhibitor 228 0.0087 Fixed kidney 53 0.0450 IPK after tubular cell inhibitor 225 0.0800 TABLE 1. Reported sieving coefficients for albumin in studies with "controlled" tubular modification

10
Properties of the Glomerular Barrier and Mechanisms of Proteinuria
TABLE 2.Sieving coefficients for various proteins in selected studies Type of Protein SE Radius Sieving Coefficient Charge References Neutral or slightly cationic proteins nAlbumin 35.5 0.0330 228 0.0260 19 Kappa-dimer 28.4 0.1490 179 nHRP 32.0 0.0700 348 0.1100 302 nMyoglobin 19.6 0.7700 cMyoglobin 17.5 0.7400 2 IgG 54.0 0.0023 18 LDH-5 46.0 0.0056 176 Anionic proteins Albumin 0.0021 –23 0.0015 214 0.0006 0.0007 Ovalbumin 27.4 0.0770 –13 301 Orosomucoid 40.5 0.0036 –24 aHRP 0.0690 –6 0.0450 –11 0.0170 224 0.0100 –14 aMyoglobin 0.5100 LDH-1 0.0011 –19

11
alb=CB/CP FIG. 9. Glomerular size selectivity is illustrated by a plot of sieving coefficients for neutral Ficoll versus molecular radius. Biological data from two studies are presented together with simulated curves. The experiments were performed on intact rats (○) with a lognormal pore distribution model (219) and data from cIPK in mice () together with a fiber model (134). Both models describe the biological data with reasonable accuracy, as does a two-pore model (212, 213, 301) not shown in the graph. Ficoll: high mass, neutral polysaccharide, radius 2-7 nm. Sieving coefficient: clearance/UF or amount of equilibration between donating and receiving system. SC=1 means full equilibration, i.e., no resistance to flow across a membrane. Haraldsson B et al. Physiol Rev 2008;88: ©2008 by American Physiological Society
 with a lognormal pore distribution model (219) and data from cIPK in mice () together with a fiber model (134). Both models describe the biological data with reasonable accuracy, as does a two-pore model (212, 213, 301) not shown in the graph. Ficoll: high mass, neutral polysaccharide, radius 2-7 nm. Sieving coefficient: clearance/UF or amount of equilibration between donating and receiving system. SC=1 means full equilibration, i.e., no resistance to flow across a membrane. Haraldsson B et al. Physiol Rev 2008;88: ©2008 by American Physiological Society.")
12
. alb=CB/CP FIG. 10. Glomerular sieving coefficients for neutral Ficoll, neutral proteins, and anionic proteins plotted against molecular radius. Two Ficoll sieving curves are presented based on data from cIPK studies in rats (301) and mice (134). The neutral and anionic proteins can be found in Table 2 together with references. The anionic proteins differ considerably in net charge, even for the same protein, depending on the experimental conditions (see, e.g., anionic HRP in Table 2). Haraldsson B et al. Physiol Rev 2008;88: ©2008 by American Physiological Society
 and mice (134). The neutral and anionic proteins can be found in Table 2 together with references. The anionic proteins differ considerably in net charge, even for the same protein, depending on the experimental conditions (see, e.g., anionic HRP in Table 2). Haraldsson B et al. Physiol Rev 2008;88: ©2008 by American Physiological Society.")
13
. - + --- alb=CB/CP FIG. 11. The fractional clearance or sieving coefficient of a solute plotted against its Stokes-Einstein radius. From the top, the curves represent slightly positive solutes (with charge densities of Coul/m2), neutral solutes, negatively charged solutes (with charge densities of –0.006 Coul/m2), and highly negative solute charge similar to that of albumin (–0.022 Coul/m2). The clearance ratio of neutral over strongly negative solutes was 20:1 or higher in the molecular radius range of 30–40 Å. The curves are based on a heterogeneous charged fiber model (122) based on the work of Johnson and Deen (136), with a fiber radius of 4.5 Å, a relative fiber volume of 0.055, and a fiber charge density of –0.2 Coul/m2. The charged fiber gel consists of two parallel regions that differ in fiber density. One of the regions has only 10% of the fiber density of the rest of the gel. However, this "nonselective" region constitutes only a minute fraction of the total gel and contributes to ∼0.1% of the total hydraulic conductance of the charged fiber gel. In other models, such high-permeable regions have been named "shunt pathways" or "large pores." For more detail, please consult Haraldsson B et al. Physiol Rev 2008;88: ©2008 by American Physiological Society
, neutral solutes, negatively charged solutes (with charge densities of –0.006 Coul/m2), and highly negative solute charge similar to that of albumin (–0.022 Coul/m2). The clearance ratio of neutral over strongly negative solutes was 20:1 or higher in the molecular radius range of 30–40 Å. The curves are based on a heterogeneous charged fiber model (122) based on the work of Johnson and Deen (136), with a fiber radius of 4.5 Å, a relative fiber volume of 0.055, and a fiber charge density of –0.2 Coul/m2. The charged fiber gel consists of two parallel regions that differ in fiber density. One of the regions has only 10% of the fiber density of the rest of the gel. However, this nonselective region constitutes only a minute fraction of the total gel and contributes to ∼0.1% of the total hydraulic conductance of the charged fiber gel. In other models, such high-permeable regions have been named shunt pathways or large pores. For more detail, please consult Haraldsson B et al. Physiol Rev 2008;88: ©2008 by American Physiological Society.")
14
alb=CB/CP Pore size increase from 5nm to 6nm. Decreased FR by 50%
FIG. 14. Sieving in a homogeneous membrane for three hypothetical conditions. The baseline case corresponds to a pore radius (rp) of 5.0 nm. The other curves are those predicted for a selective increase in pore radius to 6.0 nm or a selective decrease in the filtrate velocity to one-half of the baseline level. See text for other parameter values. (Pore radius) Haraldsson B et al. Physiol Rev 2008;88: ©2008 by American Physiological Society
 of 5.0 nm. The other curves are those predicted for a selective increase in pore radius to 6.0 nm or a selective decrease in the filtrate velocity to one-half of the baseline level. See text for other parameter values. (Pore radius) Haraldsson B et al. Physiol Rev 2008;88: ©2008 by American Physiological Society.")
15
. alb=CB/CP FIG. 15. Sieving in single-layer and two-layer membranes. The overall sieving coefficient (Θ) is plotted as a function of the Peclet number in layer 1 (Pe1). Curves are shown for a single-layer membrane (W1 = 0.01); a membrane in which a second, identical layer has been added upstream or downstream from the first (W1 = W2 = 0.01); and a membrane with a second, less selective layer added upstream from the first (W1 = 0.1, W2 = 0.01). In the two-layer membranes, it was assumed that Pe1 = Pe2. Haraldsson B et al. Physiol Rev 2008;88: ©2008 by American Physiological Society
 is plotted as a function of the Peclet number in layer 1 (Pe1). Curves are shown for a single-layer membrane (W1 = 0.01); a membrane in which a second, identical layer has been added upstream or downstream from the first (W1 = W2 = 0.01); and a membrane with a second, less selective layer added upstream from the first (W1 = 0.1, W2 = 0.01). In the two-layer membranes, it was assumed that Pe1 = Pe2. Haraldsson B et al. Physiol Rev 2008;88: ©2008 by American Physiological Society.")
16
6=effacement, foot process
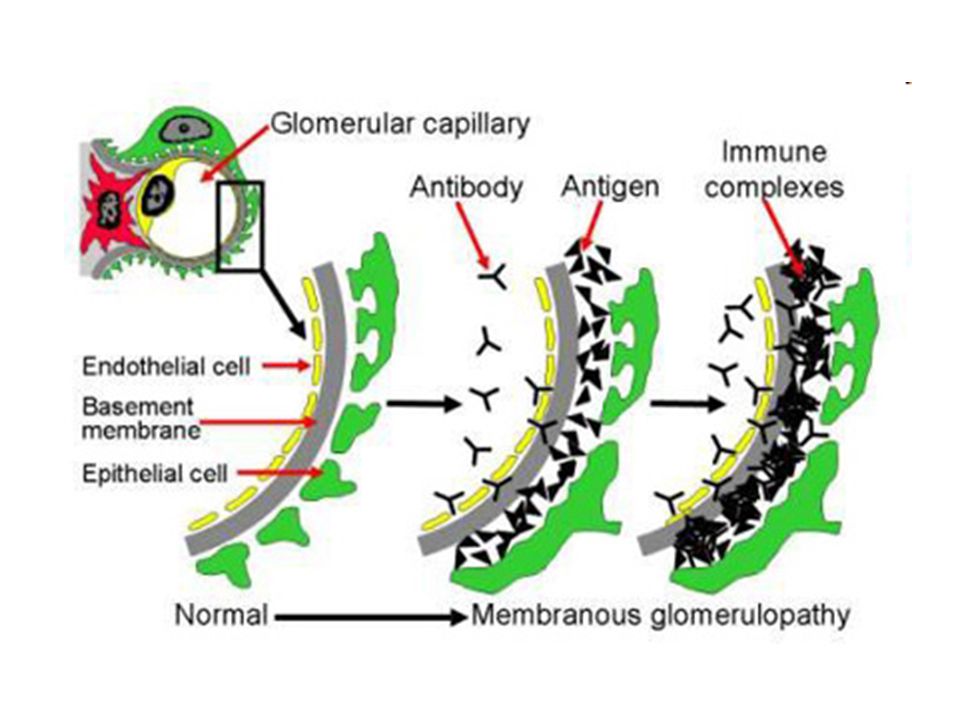
1= subepithelial, MN 2=subepithelial humps, post-infectiours GN 3=Subendothelial 4=Mesangial 5=GMB-Ab complex e.g., Goodpasture’s 6=effacement, foot process Anatomy of a normal glomerular capillary is shown on the left. Note the fenestrated endothelium (EN), glomerular basement membrane (GBM), and the epithelium with its foot processes (EP). The mesangium is composed of mesangial cells (MC) surrounded by extracellular matrix (MM) in direct contact with the endothelium. Ultrafiltration occurs across the glomerular wall and through channels in the mesangial matrix into the urinary space (US). Typical localization of immune deposits and other pathologic changes is depicted on the right. (1) Uniform subepithelial deposits as in membranous nephropathy. (2) Large, irregular subepithelial deposits or "humps" seen in acute postinfectious glomerulonephritis. (3) Subendothelial deposits as in diffuse proliferative lupus glomerulonephritis. (4) Mesangial deposits characteristic of immunoglobulin A nephropathy. (5) Antibody binding to the glomerular basement membrane (as in Goodpasture's syndrome) does not produce visible deposits, but a smooth linear pattern is seen on immunofluorescence. (6) Effacement of the epithelial foot processes is common in all forms of glomerular injury with proteinuria. (Redrawn, with permission, from Luke RG et al. Nephrology and hypertension. In: Medical Knowledge Self-Assessment Program IX. American College of Physicians, 1992.)
, glomerular basement membrane (GBM), and the epithelium with its foot processes (EP). The mesangium is composed of mesangial cells (MC) surrounded by extracellular matrix (MM) in direct contact with the endothelium. Ultrafiltration occurs across the glomerular wall and through channels in the mesangial matrix into the urinary space (US). Typical localization of immune deposits and other pathologic changes is depicted on the right. (1) Uniform subepithelial deposits as in membranous nephropathy. (2) Large, irregular subepithelial deposits or humps seen in acute postinfectious glomerulonephritis. (3) Subendothelial deposits as in diffuse proliferative lupus glomerulonephritis. (4) Mesangial deposits characteristic of immunoglobulin A nephropathy. (5) Antibody binding to the glomerular basement membrane (as in Goodpasture s syndrome) does not produce visible deposits, but a smooth linear pattern is seen on immunofluorescence. (6) Effacement of the epithelial foot processes is common in all forms of glomerular injury with proteinuria. (Redrawn, with permission, from Luke RG et al. Nephrology and hypertension. In: Medical Knowledge Self-Assessment Program IX. American College of Physicians, 1992.)")
17
NORMAL GBM. LEFT - a single glomerulus
NORMAL GBM. LEFT - a single glomerulus. There are one million of these in each kidney. RIGHT - a close up of the GBM (G) around part of one tiny blood vessel in a glomerulus (red circle in left hand diagram)
 around part of one tiny blood vessel in a glomerulus (red circle in left hand diagram)")
18
Diagram of a blood vessel with a normal GBM in a glomerulus (compare with the diagram above)
A blood vessel with a thin GBM Thin Glomerular Membrane Disease

19
Lipid Accumulation Patients 1&2, In tubular Epithelial cells. Figure 1
Lipid accumulation in human kidney samples visualized by Oil Red O staining Kidney surgical specimens were obtained from patients undergoing radical nephrectomy for renal cell carcinoma. Normal kidney cortex samples were dissected by an experienced pathologist, away from the tumor. The samples were frozen, sectioned, and stained with hematoxylin and Oil Red O to visualize the distribution of lipids within renal structures. Left panels are representative images from three different patients (original color images are shown here in gray scale). For each image, a computer-based color deconvolution algorithm was used to separately visualize Oil Red O staining in the red channel (right panels). In these examples, lipid deposits are localized mostly within tubular epithelial cells in patients 1 and 2, but are not detectable in patient 3.
. For each image, a computer-based color deconvolution algorithm was used to separately visualize Oil Red O staining in the red channel (right panels). In these examples, lipid deposits are localized mostly within tubular epithelial cells in patients 1 and 2, but are not detectable in patient 3.")
20
Overwhelms beta-oxidation
High Alb filtration Luminal or apical side (a) Under normal conditions, fatty acids enter the proximal tubule cell from the basolateral side as well as from the apical (luminal) side, carried on albumin. Albumin is degraded in lysosomes, but transcytosis has also been proposed. Depending on cellular energy needs, intracellular fatty acids are directed to mitochondrial b-oxidation or to triglyceride stores. (b) Several conditions can theoretically lead to increased fatty acid intake into the proximal tubule cell, including high albumin filtration, high fatty acid to albumin molar ratio, and circulating lipid disturbances. These conditions, alone or in combination, may cause increased intracellular concentration of fatty acids, exceeding the b-oxidative capacity of mitochondria. This leads to intracellular accumulation of triglycerides and to the generation of lipid metabolites with potential toxic effect. Entry of free non-esterified fatty acids into proximal tubule cells and the role of albumin as ‘Trojan horse’
 Under normal conditions, fatty acids enter the proximal tubule cell from the basolateral side as well as from the apical (luminal) side, carried on albumin. Albumin is degraded in lysosomes, but transcytosis has also been proposed. Depending on cellular energy needs, intracellular fatty acids are directed to mitochondrial b-oxidation or to triglyceride stores. (b) Several conditions can theoretically lead to increased fatty acid intake into the proximal tubule cell, including high albumin filtration, high fatty acid to albumin molar ratio, and circulating lipid disturbances. These conditions, alone or in combination, may cause increased intracellular concentration of fatty acids, exceeding the b-oxidative capacity of mitochondria. This leads to intracellular accumulation of triglycerides and to the generation of lipid metabolites with potential toxic effect. Entry of free non-esterified fatty acids into proximal tubule cells. and the role of albumin as ‘Trojan horse’")
21
Competes with glutamine
Fatty acids may affect proximal tubule ammonium production by mitochondrial substrate competition Ammonium (NH4+) is produced in the proximal tubule by the metabolism of glutamine to α-ketoglutarate, which then continues in the Krebs cycle. The products of fatty acid β-oxidation also enter the Krebs cycle. Increased intracellular concentration of fatty acids may compete with glutamine as mitochondrial substrate, decreasing its utilization and reducing ammonium production.
 is produced in the proximal tubule by the metabolism of glutamine to α-ketoglutarate, which then continues in the Krebs cycle. The products of fatty acid β-oxidation also enter the Krebs cycle. Increased intracellular concentration of fatty acids may compete with glutamine as mitochondrial substrate, decreasing its utilization and reducing ammonium production.")
22
Normal Glomerulus Minimal Change Disease

23
Normal glomerulus FSGS

26
Membranous Nephropathy: note EDD in subepithelial area.

34
Slides courtesy of UNC Kidney Center

Similar presentations


 RENAL DISEASE: OVERVIEW AND ACUTE RENAL FAILURE Pathophysiology of Disease: Chapter 16 (388-394) Jack.>")


