Download presentation
Presentation is loading. Please wait.

1
Overview Introduction to AMOS Examples of using AMOS User Interface
AMOS Graphics Examples of using AMOS Predictors of Problem Drinking using Path analysis Today, we ‘ll have a short introduction to AMOS, using AMOS Graphics…Where you directly work with a path diagram. YOU can learn Amos Basic on your own. In AMOS BASIC you directly work from equation statements. For our purposes AMOS graphics is enough. We will learn how to draw a path model using problem drinking example. Name AMOS is an acronym “ ANALYSIS of MOMENT STRUCTURES” or in other words the analysis of mean and covariance structures.

2
SEM Software Several different packages exist
EQS, LISREL, MPLUS, AMOS, SAS, ... Provide simultaneously overall tests of model fit individual parameter estimate tests May compare simultaneously Regression coefficients Means Variances even across multiple between-subjects groups

3
AMOS Advantages Easy to use for visual SEM ( Structural Equation Modeling). Easy to modify, view the model Publication –quality graphics

4
Structural Equation Modeling (SEM)
An extension of Regression and general Linear Models Also can fit more complex models, like confirmatory factor analysis and longitudinal data. AMOS is a software was developed by James Arbuckle. Amos 4and 5 were a stand alone program, but I think starting with Amos 6 it became a part of SPSS. AMOS was developed to be used with Structural equation modeling.

5
Family Tree of SEM T-test ANOVA Multi-way ANOVA Path Structural
Repeated Measure Designs Growth Curve Analysis Latent Growth Curve Analysis Structural Equation Modeling Multiple Regression Path Analysis Bivariate Correlation You have seen that TREE of SEM before… Al you previous knowledge of statistics will be used SEM… Confirmatory Factor Analysis Factor Analysis Exploratory Factor Analysis

6
Structural Equation Modeling (SEM)
Observed variables =measured Latent variables=unobserved Exogenous variables=independent Endogenous variables =dependent Let’s talk about some notations. Observed var: the variables we actually have in the dataset Latent: not directly observed var. ex in education : verbal ability and math ability. You know that Exogenous var = Independent - they “ CAUSE” fluctuations in the values of other variables in the model. Ex: Endogenous var= Dependent variable:

7
Structural Equation Graphs
.10 : R2 Observed Variable Error .15 : Loading Within the SEM, the following notation is used: A rectangle for a observed var An oval for latent and not measured error. The path between the variables is called a loading Latent Variable

8
Example: Condom Use Model
Observed variables for Impulsive decision making IDMA1R IDMC1R IDME1R IDMJ1R Gender Impulsive Decision Making Impulsive Decision Making Peer norms about condoms Condom attitude Take a look at this model: Legend Latent Variables Observed Variables Condom use .15 Loadings

9
Example: Condom Use Model
Dependent Independent IDMA1R IDMC1R IDME1R IDMJ1R Gender Impulsive Decision Making Peer norms about condoms Independent Condom attitude Legend Dependent Condom use Latent Variables Observed Variables .15 Loadings Dependent

10
Example: Condom Use Model
eidm1 eidm2 eidm4 eidm2 IDMA1R IDMC1R IDME1R IDMJ1R Gender Impulsive Decision Making Condom attitude Peer norms about condoms efr1 eiss Legend Condom use Latent Variables Observed Variables eSXYRC1 .15 Loadings

11
Example: Condom Use Model
eidm1 eidm2 eidm4 eidm2 IDMA1R IDMC1R IDME1R IDMJ1R SEX1 Gender Impulsive Decision Making efr1 Peer norms about condoms Condom attitude Legend Condom use eiss Latent Variables Observed Variables eSXYRC1 .15 Loadings

12
Example: Condom Use Model
eidm1 eidm2 eidm4 eidm2 .15 .05 .03 IDMA1R IDMC1R IDME1R IDMJ1R Gender .49 .69 .67 -.06 .53 Impulsive Decision Making -.19 -.10 -.15 .13 Peer norms about condoms efr1 Condom attitude .11 .38 Legend Condom use eiss Latent Variables Observed Variables eSXYRC1 .15 Loadings

13
AMOS Components AMOS Graphics AMOS Basic draw SEM graphs
runs SEM models using graphs AMOS Basic runs SEM models using syntax

14
Starting AMOS Graphics
Programs Amos 6 Amos Graphics

15
Reading Data into AMOS File Data Files The following dialog appears:

16
Reading Data into AMOS Click on File Name to specify the name of the data file Currently AMOS reads the following data file formats: Access dBase 3 – 5 Microsft Excel 3, 4, 5, and 97 FoxPro 2.0, 2.5 and 2.6 Lotus wk1, wk3, and wk4 SPSS *.sav files, versions through (both raw data and matrix formats)
")
17
Reading Data into AMOS Example USED today:
Predicting parental monitoring and problem drinking using a PATH DIAGRAM. DATASET: only_valid_path_feb19_2007-n754.sav this file is in the “DROP” folder on desktop Let’a open this dataset in AMOS.

18
Drawing in AMOS In Amos Graphics, a model can be specified by drawing a diagram on the screen To draw an observed variable, click "Diagram" on the top menu, and click "Draw Observed." Move the cursor to the place where you want to place an observed variable and click your mouse. Drag the box in order to adjust the size of the box. You can also use in the tool box to draw observed variables. 2. Unobserved variables can be drawn similarly. Click "Diagram" and "Draw Unobserved." Unobserved variables are shown as circles. You may also use in the toolbox to draw unobserved variables.

19
Drawing in AMOS To draw a path, Click “Diagram” on the top menu and click “Draw Path”. Instead of using the top menu, you may use the Tool Box buttons to draw arrows ( and ).
.")
20
Drawing in AMOS To draw Error Term to the observed and unobserved variables. Use “Unique Variable” button in the Tool Box. Click and then click a box or a circle to which you want to add errors or a unique variables.(When you use "Unique Variable" button, the path coefficient will be automatically constrained to 1.)
")
21
Drawing in AMOS Let us draw: Let’s draw a following model

22
Naming the variables in AMOS
To name a variable, Click “View” on the top menu and click “Object Properties” Click on the box you want to name Click on the Text tab and enter the name of the variable in the Variable name field and /or Variable Label Now we have to name all the variables in the model

23
Naming the variables in AMOS
Example: Name the variables

24
Constraining a parameter in AMOS
The scale of the latent variable or variance of the latent variable has to be fixed to 1. Click “Object Properties“, then on the arrow between PRNTMNT1 and eprnt. Click on the Parameters tab and enter the value “1” in the Regression weight field:

25
Improving the appearance of the path diagram
You can change the appearance of your path diagram by moving objects around To move an object, click on the Move icon on the toolbar. You will notice that the picture of a little moving truck appears below your mouse pointer when you move into the drawing area. This lets you know the Move function is active. Then click and hold down your left mouse button on the object you wish to move. With the mouse button still depressed, move the object to where you want it, and let go of your mouse button. Amos Graphics will automatically redraw all connecting arrows.

26
Improving the appearance of the path diagram
To change the size and shape of an object, first press the Change the shape of objects icon on the toolbar. You will notice that appears under the mouse pointer to let you know the Shape function is active. Click and hold down your left mouse button on the object you wish to re-shape. Change the shape of the object to your liking and release the mouse button. Change the shape of objects also works on two-headed arrows. Follow the same procedure to change the direction or arc of any double-headed arrow.

27
Improving the appearance of the path diagram
If you make a mistake, there are always three icons on the toolbar to quickly bail you out: the Erase and Undo functions. To erase an object, simply click on the Erase icon and then click on the object you wish to erase. To undo your last drawing activity, click on the Undo icon and your last activity disappears. Each time you click Undo, your previous activity will be removed. If you change your mind, click on Redo to restore a change.

28
Performing the analysis in AMOS
View® Analysis Properties and click on the Output tab. There is also an Analysis Properties icon you can click on the toolbar. Either way, the Output tab gives you the following options:

29
Performing the analysis in AMOS
For our example, check the Minimization history, Standardized estimates, and Squared multiple correlations boxes. (We are doing this because these are so commonly used in analysis). To run AMOS, click on the Calculate estimates icon on the toolbar. AMOS will want to save this problem to a file. if you have given it no filename, the Save As dialog box will appear. Give the problem a file name; let us say, tutorial1:
. To run AMOS, click on the Calculate estimates icon on the toolbar. AMOS will want to save this problem to a file. if you have given it no filename, the Save As dialog box will appear. Give the problem a file name; let us say, tutorial1:")
30
Results When AMOS has completed the calculations, you have two options for viewing the output: text output, graphics output. For text output, click the View Text Output icon on the toolbar. Here is a portion of the text output for this problem:

31
Results for Path Model The model is recursive. Sample size = 754 Chi-square= Degrees of Freedom =9 Maximum Likelihood Estimates Regression Weights: (Group number 1 - Default model)
")
32
Standardized Regression Weights: (Group number 1 - Default model)
")
33
Standardized Regression Weights: (Group number 1 - Default model)
")
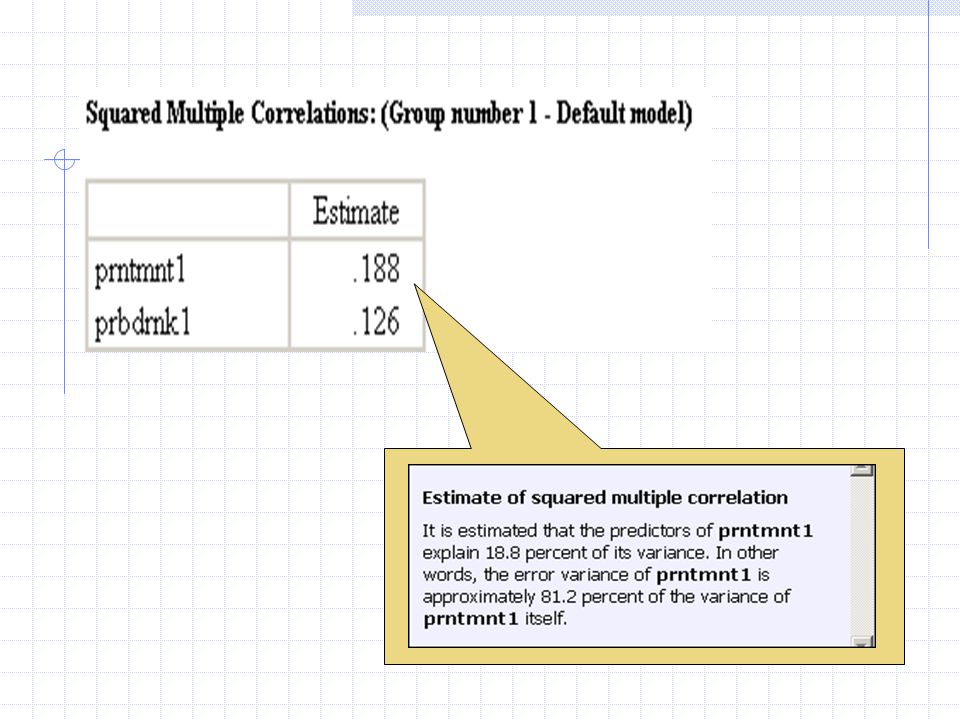
37
Viewing the graphics output in AMOS
To view the graphics output, click the View output icon next to the drawing area. Chose to view either unstandardized or (if you selected this option) standardized estimates by click one or the other in the Parameter Formats panel next to your drawing area:
 standardized estimates by click one or the other in the Parameter Formats panel next to your drawing area:")
38
Unstandardized path model

39
Improving the appearance of the path diagram
To move the parameters, click on the “Move Parameter values” and then click on the path, and move the parameter

40
Conclusion: Amos In nutshell
Today we learned ONE thing: how to draw a model in AMOS Topics for the next few weeks : assess and interpret the models compare models analyze more complex models

Similar presentations


>")


 Kentaka Aruga.>")
 with boxes into.>")

