Download presentation
Presentation is loading. Please wait.

1
Control Charts Chapter 5

2
Introduction In industrial processes, goals are to: -. We need to ___________ an engineering process to ensure these goals are met. Examples: - monitor process for filling 16 oz cans of pepsi of pepsi - maintain correct outside diameter of ball point pens ball point pens

3
Example A 10-oz packaging line for a popular cereal has a target net weight of 10.5oz. Historically, process standard deviation is 0.1oz. The company monitors net weights by a random sample of 5 boxes of cereal each hour. The mean net weights for 30 such subgroups is:

4
Data 10.56, 10.56, 10.46,10.46, 10.49, 10.52, 10.53,10.47, 10.44, 10.54, 10.49, 10.52, 10.53,10.50, 10.50, 10.48, 10.55, 10.68, 10.67,10.62, 10.45, 10.47, 10.40, 10.43, 10.47,10.50, 10.38, 10.43, 10.50, 10.51 The target net mean weight is μ 0 =10.5oz.

5
Let y i = the weight of the ith box of cereal (i=1,…,5) at hour t. (t=1,…,30). Let μ(t) be the process mean (the true mean weight at this time). A model we can use is: ε i is the random error associated with this box of cereal. We assume here that the process variance σ 2 is constant.
. Let μ(t) be the process mean (the true mean weight at this time). A model we can use is: ε i is the random error associated with this box of cereal. We assume here that the process variance σ 2 is constant..")
6
Factors that may influence process . These factors change over time, which will influence the true mean weight of the cereal boxes.

7
Typical Drift in a Process Mean over time μ(t) μ0μ0 t
 μ0μ0 t")
8
Dealing with Process Changes Do: Inspect ________ item and remove the unacceptable items. Very expensive, not always 100% effective. Produce batches of products, use statistics to determine if entire batch unacceptable. Constantly monitor true mean weight, and adjust process whenever it begins to drift. Can use control charts here. Create a process that cannot produce an unacceptable product. What we strive for.

9
Control Charts Are used to: A random sample (a subgroup) is taken from process on a: As soon as data collected:
 is taken from process on a: As soon as data collected:")
10
A control chart for a process mean Is equivalent to carrying out a hypothesis test at each time point. In cereal example: H 0 : H 1 : If we reject the null hypothesis at a specified level of significance (e.g. 5%), we conclude the true mean weight of cereal boxes has moved away from the target value of 10.5 oz at that time point.
, we conclude the true mean weight of cereal boxes has moved away from the target value of 10.5 oz at that time point..")
11
Control Limits of an …. Chart Upper Control Limit UCL: Lower Control Limit LCL:

12
Cereal Example X-bar Chart UCL=10.63 μ 0 =10.5 Out of control In control LCL=10.37 time

13
.. Chart of Cereal Box Weights

14
Conclusions for Cereal Example The control chart suggests the process is: After this it is within control limits, but appears to be a downward trend. Process:

15
The np control chart Instead of monitoring the mean of the process, for example, average weight of cereal packages, we may be interested in the: Here, we also use a control chart, but a slightly different one.

16
Brick Example A study looked at the number of non- conforming bricks from a manufacturing process. It is known from historic data that the target proportion of non-conforming bricks is 0.06625. Process monitored by taking a random sample of 200 bricks every day for 16 days. Each brick was classified as either - conforming - non-conforming. - non-conforming.

17
Let p 0 be the target proportion of nonconforming bricks. Let y i be the number of nonconforming bricks on day i. Expected value E[yi]=np 0 Variance Var[yi]=np 0 (1-p 0 ). As process stays in control, with same sample size each day, the expected value and variance stay constant.
. As process stays in control, with same sample size each day, the expected value and variance stay constant..")
18
An np control chart Examines the: Is equivalent to carrying out a hypothesis test at each time point. n is the number of items collected:

19
In Brick Example Our true hypotheses are: H 0 : H 0 : H 1 : H 1 : Our control limits take the form:

20
In Brick Example The control limits are:

21
Brick Example Check data and Figure 5.22 on page 330 in text.

22
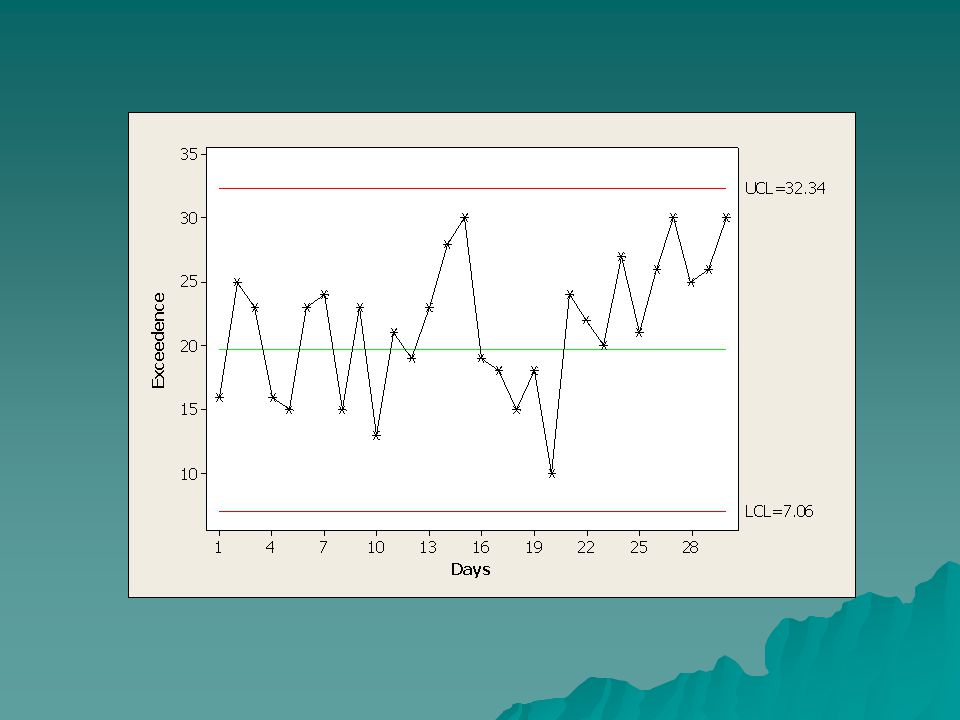
Class Exercise Airplanes approaching the runway for landing are required to stay within a certain distance (left and right) of the runway. Deviations are called “exceedences”. Each day, one airline randomly selects 200 flights and records the number in exceedence. The following data presents the number of flights in exceedence on each of 30 days in a row.

23
16 25 23 16 15 23 24 15 23 13 21 19 23 28 30 19 18 15 18 10 24 22 20 27 21 26 30 25 26 30 It is known historically that the exceedence rate is 0.0985 for this airline. Calculate the appropriate control limits and plot the control chart.

24
Here n=200

Similar presentations

![[1] MA4104 Business Statistics Spring 2008, Lecture 06 Process Monitoring Using Statistical Control Charts [ Examples Class ]](/13/3878381/big_thumb.jpg "[1] MA4104 Business Statistics Spring 2008, Lecture 06 Process Monitoring Using Statistical Control Charts [ Examples Class ]>")


 REJECT Compute the Sample Mean.>")


