Download presentation
Presentation is loading. Please wait.

1
Chapter 6: Mechanical Properties
ISSUES TO ADDRESS... • Stress and strain: What are they and stress-strain curve. • Elastic behavior: When loads are small, how much deformation occurs? What materials deform least? • Plastic behavior: At what point does permanent deformation occur? What materials are most resistant to permanent deformation? • Ductility, Toughness, Resilience, Hardness

2
CONCEPTS OF STRESS AND STRAIN
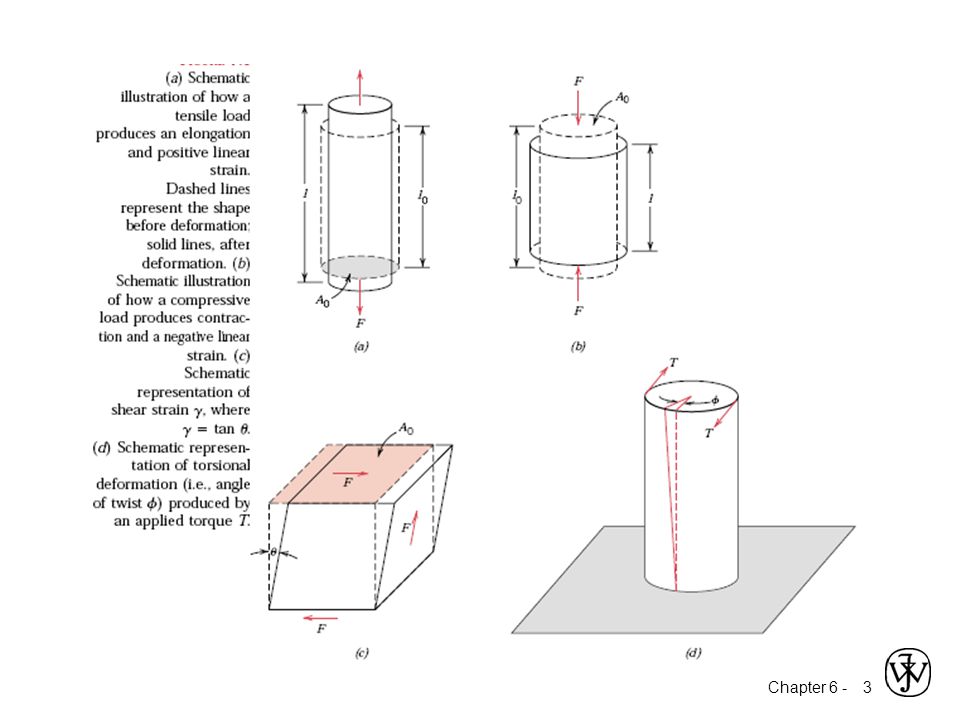
If a load is static or changes relatively slowly with time and is applied uniformly over a cross section or surface of a member, the mechanical behavior may be ascertained by a simple stress–strain test; There are four principal ways in which a load may be applied: namely, tension, compression, shear, and torsion

4
Elastic Deformation d F F d 1. Initial 2. Small load 3. Unload
bonds stretch return to initial F d Linear- elastic Non-Linear- Elastic means reversible Time independent!

5
Plastic Deformation (Metals)
1. Initial 2. Small load 3. Unload p lanes still sheared F d elastic + plastic bonds stretch & planes shear plastic F d linear elastic plastic Plastic means permanent!

6
Engineering Stress F t s = A F t s = A m N or in lb
• Tensile stress, s: original area before loading Area, A F t s = A o 2 f m N or in lb • Shear stress, t: Area, A F t s = A o Stress has units: N/m2 or lbf/in2

7
Common States of Stress
• Simple tension: cable A o = cross sectional area (when unloaded) F o s = F A s Ski lift • Torsion (a form of shear): drive shaft M A o 2R F s c o t = M R I
 F. o. s. = F. A. s. Ski lift. • Torsion (a form of shear): drive shaft. M. A. o. 2R. F. s. c. o. t. = M. R. I.")
8
OTHER COMMON STRESS STATES (1)
• Simple compression: A o Balanced Rock, Arches National Park (photo courtesy P.M. Anderson) Canyon Bridge, Los Alamos, NM o s = F A Note: compressive structure member (s < 0 here). (photo courtesy P.M. Anderson)
 Canyon Bridge, Los Alamos, NM. o. s. = F. A. Note: compressive. structure member. (s < 0 here). (photo courtesy P.M. Anderson)")
9
OTHER COMMON STRESS STATES (2)
• Bi-axial tension: • Hydrostatic compression: Fish under water Pressurized tank (photo courtesy P.M. Anderson) (photo courtesy P.M. Anderson) s z > 0 q s < 0 h
 (photo courtesy. P.M. Anderson) s. z. > 0. q. s < 0. h.")
10
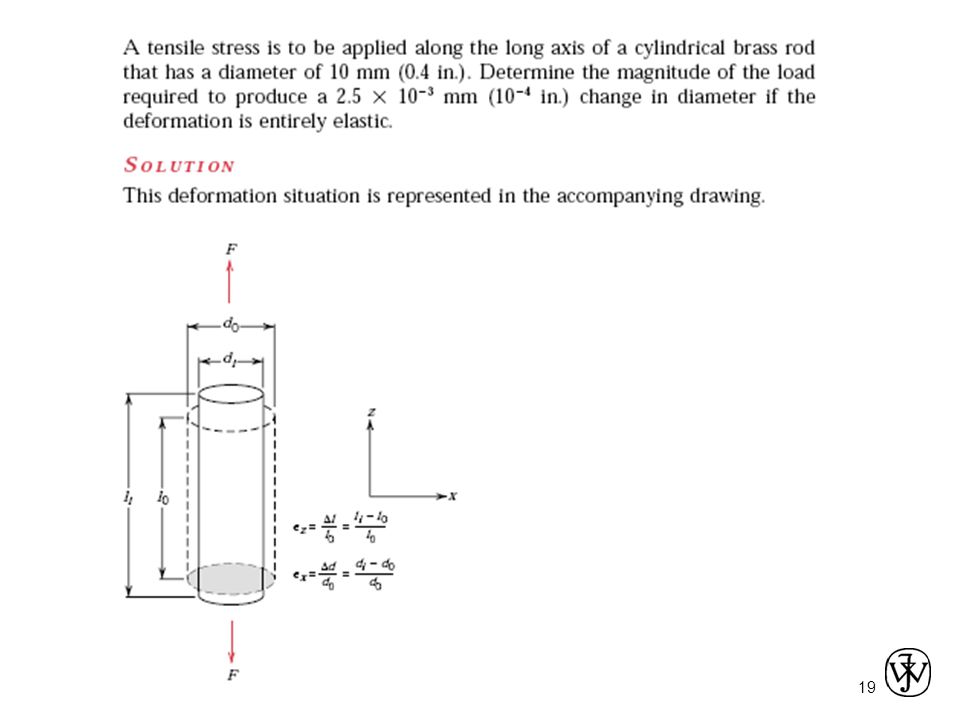
Engineering Strain w e = d L d e = w q q g = Dx/y = tan
• Tensile strain: d /2 L o w • Lateral strain: e = d L o d e L = w o = L=L-L0 • Shear strain: q x q g = Dx/y = tan y 90º - q Strain is always dimensionless. 90º

11
Stress-Strain Testing
• Typical tensile test machine • Typical tensile specimen gauge length Load measured specimen extensometer Strain measured We can obtained many important properties of materials from stress-strain diagram

12
(linear)Elastic Properties of materials
• Modulus of Elasticity, E : (also known as Young's modulus) • Hooke's Law: s = E e s Linear- elastic E e F simple tension test
 • Hooke s Law: s = E e. s. Linear- elastic. E. e. F. simple. tension. test.")
13
Poisson's ratio, n e n = - • Poisson's ratio, n: Units:
L metals: n ~ 0.33 ceramics: n ~ 0.25 polymers: n ~ 0.40 Units: E: [GPa] or [psi] n: dimensionless

14
Mechanical Properties
Slope of stress strain plot (which is proportional to the elastic modulus) depends on bond strength of metal The magnitude of E is measured of the resistance to separation of adjacent atoms, that is, the interatomic bonding forces So E α (dF/dr)
 depends on bond strength of metal. The magnitude of E is measured of the resistance to separation of adjacent atoms, that is, the interatomic bonding forces. So E α (dF/dr)")
15
T – E diagram Plot of modulus of elasticity
versus temperature for tungsten, steel, and aluminum.

16
Other Elastic Properties
simple torsion test M t G g • Elastic Shear modulus, G: t = G g stress strain • Elastic Bulk modulus, K: pressure test: Init. vol =Vo. Vol chg. = DV P P = - K D V o • Special relations for isotropic materials: 2(1 + n) E G = 3(1 - 2n) K
 E. G. = 3(1 - 2n) K.")
17
Young’s Moduli: Comparison
Graphite Ceramics Semicond Metals Alloys Composites /fibers Polymers 0.2 8 0.6 1 Magnesium, Aluminum Platinum Silver, Gold Tantalum Zinc, Ti Steel, Ni Molybdenum G raphite Si crystal Glass - soda Concrete Si nitride Al oxide PC Wood( grain) AFRE( fibers) * CFRE GFRE* Glass fibers only Carbon fibers only A ramid fibers only Epoxy only 0.4 0.8 2 4 6 10 00 1200 Tin Cu alloys Tungsten <100> <111> Si carbide Diamond PTF E HDP LDPE PP Polyester PS PET C FRE( fibers) FRE( fibers)* FRE(|| fibers)* E(GPa) Composite data based on reinforced epoxy with 60 vol% of aligned carbon (CFRE), aramid (AFRE), or glass (GFRE) fibers. 109 Pa
 AFRE( fibers) * CFRE. GFRE* Glass fibers only. Carbon. fibers only. A. ramid fibers only. Epoxy only Tin. Cu alloys. Tungsten. <100> <111> Si carbide. Diamond. PTF. E. HDP. LDPE. PP. Polyester. PS. PET. C. FRE( fibers) FRE( fibers)* FRE(|| fibers)* E(GPa) Composite data based on. reinforced epoxy with 60 vol% of aligned. carbon (CFRE), aramid (AFRE), or. glass (GFRE) fibers. 109 Pa.")
18
Useful Linear Elastic Relationships
• Simple tension: • Simple torsion: a = 2 ML o p r 4 G M = moment = angle of twist 2ro Lo d = FL o E A d L = - n Fw o E A F A o d /2 L Lo w • Material, geometric, and loading parameters all contribute to deflection. • Larger elastic moduli minimize elastic deflection.

21
Plastic (Permanent) Deformation
(at lower temperatures, i.e. T < Tmelt/3) • Simple tension test: Elastic+Plastic engineering stress, s at larger stress Yielding stress y Elastic initially permanent (plastic) after load is removed ep engineering strain, e plastic strain
 • Simple tension test: Elastic+Plastic. engineering stress, s. at larger stress. Yielding stress. y. Elastic. initially. permanent (plastic) after load is removed. ep. engineering strain, e. plastic strain.")
22
Plastic properties of materials
Yield Strength, sy Tensile Strength, TS Ductility Toughness Resilience, Ur

23
Yield Strength, sy y = yield strength sy
• Stress at which noticeable plastic deformation has occurred. when ep = 0.002 tensile stress, s engineering strain, e sy p = 0.002 y = yield strength Note: for 2 inch sample = = z/z z = in

24
Yield Strength : Comparison
Graphite/ Ceramics/ Semicond Metals/ Alloys Composites/ fibers Polymers Yield strength, s y (MPa) PVC Hard to measure , since in tension, fracture usually occurs before yield. Nylon 6,6 LDPE 70 20 40 60 50 100 10 30 2 00 3 4 5 6 7 Tin (pure) Al (6061) a ag Cu (71500) hr Ta (pure) Ti Steel (1020) cd (4140) qt (5Al-2.5Sn) W Mo (pure) cw Hard to measure, in ceramic matrix and epoxy matrix composites, since in tension, fracture usually occurs before yield. H DPE PP humid dry PC PET Room T values a = annealed hr = hot rolled ag = aged cd = cold drawn cw = cold worked qt = quenched & tempered
 PVC. Hard to measure. , since in tension, fracture usually occurs before yield. Nylon 6,6. LDPE Tin (pure) Al. (6061) a. ag. Cu. (71500) hr. Ta. (pure) Ti. Steel. (1020) cd. (4140) qt. (5Al-2.5Sn) W. Mo (pure) cw. Hard to measure, in ceramic matrix and epoxy matrix composites, since. in tension, fracture usually occurs before yield. H. DPE. PP. humid. dry. PC. PET. Room T values. a = annealed. hr = hot rolled. ag = aged. cd = cold drawn. cw = cold worked. qt = quenched & tempered.")
25
Tensile Strength, TS TS engineering stress strain engineering strain
• Maximum stress on engineering stress-strain curve. y strain Typical response of a metal F = fracture or ultimate strength Neck – acts as stress concentrator engineering TS stress engineering strain • Metals: occurs when noticeable necking starts. • Polymers: occurs when polymer backbone chains are aligned and about to break.

26
Tensile Strength : Comparison
Si crystal <100> Graphite/ Ceramics/ Semicond Metals/ Alloys Composites/ fibers Polymers Tensile strength, TS (MPa) PVC Nylon 6,6 10 100 200 300 1000 Al (6061) a ag Cu (71500) hr Ta (pure) Ti Steel (1020) (4140) qt (5Al-2.5Sn) W cw L DPE PP PC PET 20 30 40 2000 3000 5000 Graphite Al oxide Concrete Diamond Glass-soda Si nitride H wood ( fiber) wood(|| fiber) 1 GFRE (|| fiber) ( fiber) C FRE A FRE( fiber) E-glass fib Aramid fib Room Temp. values a = annealed hr = hot rolled ag = aged cd = cold drawn cw = cold worked qt = quenched & tempered AFRE, GFRE, & CFRE = aramid, glass, & carbon fiber-reinforced epoxy composites, with 60 vol% fibers.
 PVC. Nylon 6, Al. (6061) a. ag. Cu. (71500) hr. Ta. (pure) Ti. Steel. (1020) (4140) qt. (5Al-2.5Sn) W. cw. L. DPE. PP. PC. PET Graphite. Al oxide. Concrete. Diamond. Glass-soda. Si nitride. H. wood. ( fiber) wood(|| fiber) 1. GFRE. (|| fiber) ( fiber) C. FRE. A. FRE( fiber) E-glass fib. Aramid. fib. Room Temp. values. a = annealed. hr = hot rolled. ag = aged. cd = cold drawn. cw = cold worked. qt = quenched & tempered. AFRE, GFRE, & CFRE = aramid, glass, & carbon. fiber-reinforced epoxy. composites, with 60 vol% fibers.")
27
Ductility Ductility can be expressed quantita
• Plastic tensile strain at failure: x 100 L EL % o f - = Percent elongation Engineering tensile strain, e E ngineering tensile stress, s smaller %EL larger %EL brittle Lf Ao Af Lo ductile • Another ductility measure: 100 x A RA % o f - = Percent reduction of area

28
Ductility Brittle materials are approximately considered to be those having a fracture strain of less than about 5%. Brittle materials have little or no plastic deformation upon fracture

29
Toughness • Energy to break a unit volume of material
or it is a measure of the ability of a material to absorb energy up to fracture( or impact resistance) • Approximate by the area under the stress-strain curve. very small toughness (unreinforced polymers) Engineering tensile strain, e E ngineering tensile stress, s small toughness (ceramics) large toughness (metals) Brittle fracture: elastic energy( no apparent plastic deformation takes place fracture) Ductile fracture: elastic + plastic energy(extensive plastic deformation takes place before fracture)
 • Approximate by the area under the stress-strain. curve. very small toughness. (unreinforced polymers) Engineering tensile strain, e. E. ngineering. tensile. stress, s. small toughness (ceramics) large toughness (metals) Brittle fracture: elastic energy( no apparent plastic deformation takes place fracture) Ductile fracture: elastic + plastic energy(extensive plastic deformation takes place before fracture)")
30
Fracture toughness is a property indicative of a material’s resistance to fracture when a crack is present For a material to be tough, it must display both strength and ductility; and often, ductile materials are tougher than brittle ones

31
Resilience, Ur Ability of a material to store energy when it is deformed elastically, and then, upon unloading, to have this energy recovered Energy stored best in elastic region If we assume a linear stress-strain curve this simplifies to y r 2 1 U e s @ Area under - curve taken to yielding(the shaded area)
")
32
Modulus of resilience ( is the area under curve) Thus, resilient materials are those having high yield strengths and low module of elasticity; such alloys would be used in spring applications.

33
Elastic Strain Recovery

34
Hardness • Resistance to permanently indenting the surface, or
is a measure of a materials resistance to deformation by surface indentation or by abrasion. • Large hardness means: --resistance to plastic deformation or cracking in compression. --better wear properties. e.g., 10 mm sphere apply known force measure size of indent after removing load d D Smaller indents mean larger hardness. increasing hardness most plastics brasses Al alloys easy to machine steels file hard cutting tools nitrided diamond

35
Hardness: Measurement
Rockwell No major sample damage Each scale runs to 130 but only useful in range Minor load kg Major load (A), 100 (B) & 150 (C) kg A = diamond, B = mm ball of steel, C = diamond the hardness can be taken directly from the machine, so it is a quick test HB = Brinell Hardness - P= 500, 1500, 3000 kg TS (psia) = 500 x HB TS (MPa) = 3.45 x HB (The HB and tensile strength relationship)
, 100 (B) & 150 (C) kg. A = diamond, B = mm ball of steel, C = diamond. the hardness can be taken directly from the machine, so it is a quick test. HB = Brinell Hardness. - P= 500, 1500, 3000 kg. TS (psia) = 500 x HB. TS (MPa) = 3.45 x HB. (The HB and tensile strength relationship)")
36
Hardness: Measurement
Table 6.5

37
problem Material Yielding strength ( MPa) Tensile strength Strain at fracture Fracture strength (MPa) Elastic modulus (GPa) A 310 340 0.23 265 210 B 100 120 0.4 105 150 C 415 550 0.15 500 D 700 850 0.14 720 E Fracture before yielding 650 350 a) Which experience the greatest percent reduction in area? Why? b) Which is the strongest? Why? c) Which is the stiffest? Why? d) Which is the hardest? Why?
 Elastic modulus. (GPa) A B C D E. Fracture before yielding a) Which experience the greatest percent reduction in area Why b) Which is the strongest Why c) Which is the stiffest Why d) Which is the hardest Why")
38
Material B will experience the greatest percent area reduction since it has the highest strain at fracture, and, therefore is most ductile. Material D is the strongest because it has the highest yield and tensile strengths. Material E is the stiffest because it has the highest elastic modulus. stiffness=E=σ/ε, the higher E the material more stiffest Material D is the hardest because it has the highest tensile strength.

39
Problem:

40
True Stress & Strain Note: Surf.Are. changes when sample stretched
True Strain

41
( ) Hardening s e • An increase in sy due to plastic deformation.
large hardening small hardening y 1 • Curve fit to the stress-strain response: The region of the true stress-strain curve from the onset of plastic deformation to the point at which necking begins may be approximated by s T = K e ( ) n “true” stress (F/Ai ) “true” strain: ln(L/Lo) hardening exponent: n = 0.15 (some steels) to n = 0.5 (some coppers) (n and K constants)
 n. true stress (F/Ai ) true strain: ln(L/Lo) hardening exponent: n = 0.15 (some steels) to n = 0.5 (some coppers) (n and K constants)")
42
Design or Safety Factors
• Design uncertainties mean we do not push the limit. • Factor of safety, N Often N is between 1.2 and 4 Safe stress, or The choice of an appropriate value of N is necessary. If N is too large, then component overdesign will result, that is, either too much material or a material having a higher-than-necessary strength will be used. Values normally range between1.2 and 4.0. Selection of N will depend on a number of factors, including economics, previous experience, the accuracy with which mechanical forces and material properties may be determined, and, most important, the consequences of failure in terms of loss of life and/or property damage.

43
Example: Calculate a diameter, d, to ensure that yield does not occur in the 1045 carbon steel rod below. Use a factor of safety of 5. 1045 plain carbon steel: s y = 310 MPa TS = 565 MPa F = 220,000N d L o 5 d = m = 6.7 cm

44
problem

46
Summary • Stress and strain: These are size-independent
measures of load and displacement, respectively. • Elastic behavior: This reversible behavior often shows a linear relation between stress and strain. To minimize deformation, select a material with a large elastic modulus (E or G). • Plastic behavior: This permanent deformation behavior occurs when the tensile (or compressive) uniaxial stress reaches sy. • Toughness: The energy needed to break a unit volume of material. • Ductility: The amount of plastic strain that has occurred at fracture.
. • Plastic behavior: This permanent deformation. behavior occurs when the tensile (or compressive) uniaxial stress reaches sy. • Toughness: The energy needed to break a unit. volume of material. • Ductility: The amount of plastic strain that has occurred. at fracture.")
47
problem A brass alloy is known to have a yield strength of 240 MPa (35,000 psi), a tensile strength of 310 MPa (45,000 psi), and an elastic modulus of 110 GPa ( psi). A cylindrical specimen of this alloy 15.2 mm (0.60 in.) in diameter and 380 mm (15.0 in.) long is stressed in tension and found to elongate 1.9 mm (0.075 in.). On the basis of the information given, is it possible to compute the magnitude of the load that is necessary to produce this change in length? If so, calculate the load. If not, explain why.
, a tensile strength of 310 MPa (45,000 psi), and an elastic modulus of 110 GPa ( psi). A cylindrical specimen of this alloy 15.2 mm (0.60 in.) in diameter and 380 mm (15.0 in.) long is stressed in tension and found to elongate 1.9 mm (0.075 in.). On the basis of the information given, is it possible to compute the magnitude of the load that is necessary to produce this change in length If so, calculate the load. If not, explain why.")
48
We are asked to ascertain whether or not it is possible to compute, for brass, the magnitude of the load necessary to produce an elongation of 1.9 mm (0.075 in.). It is first necessary to compute the strain at yielding from the yield strength and the elastic modulus, and then the strain experienced by the test specimen. Then, if ε(test) < ε(yield) deformation is elastic, and the load may be computed using Equations 6.1 and 6.5. However, if ε(test) > ε(yield) computation of the load is not possible inasmuch as deformation is plastic and we have neither a stress-strain plot nor a mathematical expression relating plastic stress and strain. We compute these two strain values as
 < ε(yield) deformation is elastic, and the load may be computed using Equations 6.1 and 6.5. However, if. ε(test) > ε(yield) computation of the load is not possible inasmuch as deformation is plastic and we have neither a stress-strain plot nor a mathematical expression relating plastic stress and strain. We compute these two strain values as.")
49
Therefore, computation of the load is not possible since
ε(test) > ε(yield).
 > ε(yield).")
50
problem A cylindrical metal specimen having an original diameter of 12.8 mm(0.505 in.) and gauge length of mm (2.000 in.) is pulled in tension until fracture occurs. The diameter at the point of fracture is 8.13 mm (0.320 in.), and the fractured gauge length is mm (2.920 in.). Calculate the ductility in terms of percent reduction in area and percent elongation.
 and gauge length of mm (2.000 in.) is pulled in tension until fracture occurs. The diameter at the point of fracture is 8.13 mm (0.320 in.), and the fractured gauge length is mm (2.920 in.). Calculate the ductility in terms of percent reduction in area and percent elongation.")
51
This problem calls for the computation of ductility in both percent reduction in area and percent elongation. Percent reduction in area is computed using Equation 6.12 as in which d0 and df are, respectively, the original and fracture cross-sectional areas. Thus, While, for percent elongation, we use Equation 6.11 as

Similar presentations


>")
