Download presentation
Presentation is loading. Please wait.

1
Climate Change in the Columbia Basin

2
Sediment coring in alpine environments

3
Presentation Overview: 1.Introduction to climate science - variability and extremes. 2.Projected future climate for the Basin. 3.Some implications for our land, water and communities. Climate Change in the Columbia Basin

4
Warming has Temporal Variability Climate Variability Short term: (years to decadal) ups and downs about the trend line (e.g. El Niño/La Niña) About 2 0 C Time Temperature
 About 2 0 C Time Temperature.")
5
Warming has Temporal Variability About 2 0 C Plus decadal-scale trends Climate Variability Short term: (years to decadal) ups and downs about the trend line (e.g. El Niño/La Niña)
.")
6
Average Annual Temperature has Increased Over the Last Century Climate Change Long-term trends or major shifts in climate (multi- decadal to century-scale) 19331953197319931913 6 7 8 9 5 4 C0C0 0.7 to 1.7 0 C at weather stations across the Basin
 C0C0 0.7 to C at weather stations across the Basin")
7
1970 - 1977

8
1977 - 1986

9
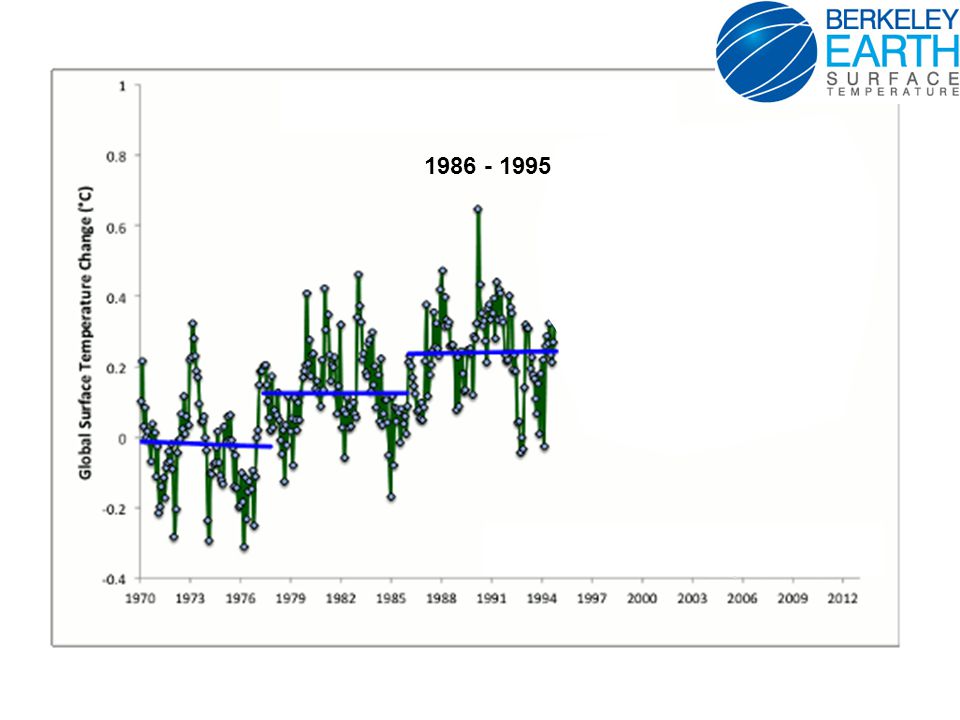
1986 - 1995
10
1995 - 2001

11
2001 - 2012

13
19331953197319931913 6 7 8 9 5 4 C0C0 Data from Basin Average Annual Temperature has Increased over the Last Century …and is impacting the frequency of extreme events

14
Increase in Mean Temperature ColdHotAverage Historical Climate Probability of occurrence

15
Less cold weather Historical Climate New Climate More hot weather ColdHotAverage More Record hot weather Increase in Mean Temperature Probability of occurrence

16
More hot weather More cold weather Increase in Variance ColdHotAverage Historical Climate New Climate More record cold weather More record hot weather Probability of occurrence

17
Increase in Mean Temperature & Variance ColdHotAverage Historical Climate Probability of occurrence

18
Less change In cold weather ColdHotAverage Historical Climate New Climate Much more hot weather and record hot weather Increase in Mean Temperature & Variance Probability of occurrence

19
The Data 0.1 – 0.2 % 4 – 13 %

20
Temperature Anomaly 0 C Warming has Spatial Variability *

21
* Temperature Anomaly 0 C

22
Warming has Spatial Variability *** Temperature Anomaly 0 C

23
Warming has Spatial Variability * Temperature Anomaly 0 C

24
Warming has Spatial Variability ** Temperature Anomaly 0 C

30
“Prediction is very difficult, especially about the future.” Yogi Berra

31
National Academy of Sciences National Academy of Engineering Institute of Medicine National Research Council “Most of the warming over the last several decades can be attributed to human activities that release carbon dioxide (CO2) and other heat-trapping greenhouse gases (GHGs) into the atmosphere.” “The burning of fossil fuels—coal, oil, and natural gas—for energy is the single largest human driver of climate change.”. “Human-induced climate change and its impacts will continue for many decades, and in some cases for many centuries.” SCIENTIFIC CONSENSUS

34
100,000200,000300,000400,000500,000600,0000 Age (yr BP)) 180 200 220 240 280 300 260 CO 2 (ppm)
) CO 2 (ppm)")
35
1 100,000200,000300,000400,000500,000600,0000 Age (yr BP)) 180 200 220 240 280 300 260 CO 2 (ppm)
) CO 2 (ppm)")
36
Petit et al. (1999) Nature 399:429-436 “Natural Range” CO2 Today 393ppm Projections 2100 AD CO 2 (450-1100) CH 4 (1500-3700) 100 yr Age (yr BP) 100,000200,000300,000400,000500,000600,000 0 200 240 280 300 CO 2 (ppm)
 Nature 399: Natural Range CO2 Today 393ppm Projections 2100 AD CO 2 ( ) CH 4 ( ) 100 yr Age (yr BP) 100,000200,000300,000400,000500,000600, CO 2 (ppm).")
37
Understanding and responding to climate change (Highlights of National Academies Reports, 2008) Advancing the Science of Climate Change, America's Climate Choices: Panel on Advancing the Science of Climate Change; National Research Council (2010) National Academy of Sciences National Academy of Engineering Institute of Medicine National Research Council
 Advancing the Science of Climate Change, America s Climate Choices: Panel on Advancing the Science of Climate Change; National Research Council (2010) National Academy of Sciences National Academy of Engineering Institute of Medicine National Research Council")
38
...Provides Perspective Projections 2100 AD Global Temperature (deg C) 1 2 3 4 5
")
39
Global models can be downscaled for regional studies

40
Canadian Regional Climate Model 3.6 Change in annual mean screen (2m) temperature (°C) in 2041-2060 relative to 1971-1990 simulated by CRCM3.6.1 *
 temperature (°C) in relative to simulated by CRCM3.6.1 *")
41
Climate Profile for Castlegar Climate element Projected future change in the Central Kootenay By 2050s Average temperature ANNUAL +1.9 o C (+1.1 to +2.8) Average precipitation ANNUAL +5% (-3% to +11%) Average temperature SUMMER 2.4 o C (+1.6 to +3.2) Average precipitation SUMMER -8% (-20% to -2%) Average temperature WINTER 1.7 o C (+0.8 to +3.3) Average precipitation WINTER +7% (-3% to +17%) Average Snowfall WINTER -9% (-16% to +4%) Average Snowfall SPRING -52% (-73% to -5%)
 Average precipitation ANNUAL +5% (-3% to +11%) Average temperature SUMMER 2.4 o C (+1.6 to +3.2) Average precipitation SUMMER -8% (-20% to -2%) Average temperature WINTER 1.7 o C (+0.8 to +3.3) Average precipitation WINTER +7% (-3% to +17%) Average Snowfall WINTER -9% (-16% to +4%) Average Snowfall SPRING -52% (-73% to -5%)")
42
Climate Profile for Castlegar Climate element Projected future change in the Central Kootenay By 2050s Average temperature ANNUAL +1.9 o C (+1.1 to +2.8) Average precipitation ANNUAL +5% (-3% to +11%) Average temperature SUMMER 2.4 o C (+1.6 to +3.2) Average precipitation SUMMER -8% (-20% to -2%) Other Variables Annual Growing Degree Days +326 (+177 to 471) Annual Heating Degree Days -679 (-1001 to -407) Annual Frost-Free Days +26 (+16 to +37)
 Average precipitation ANNUAL +5% (-3% to +11%) Average temperature SUMMER 2.4 o C (+1.6 to +3.2) Average precipitation SUMMER -8% (-20% to -2%) Other Variables Annual Growing Degree Days +326 (+177 to 471) Annual Heating Degree Days -679 (-1001 to -407) Annual Frost-Free Days +26 (+16 to +37)")
43
Up to four times as many warm summer days and nights. Climate Extremes in the Canadian Columbia Basin: A Preliminary Assessment (2012)
.")
44
38 o C 42 o C

45
Extreme Events in the Basin Time Temperature or Precipitation Two to eleven-fold increase in the occurrence of 25-year record extremely hot days. Two to three-fold increase in the frequency of extreme precipitation events with 5-, 10- and 25-year return periods.

46
Projected Impacts for the Basin e.g. Transportation From Dialogue to Action

47
Projected Impacts for the Basin e.g. Transportation e.g. Infrastructure

48
Climatic Extremes – One Example 48 4 people killed 4 houses destroyed Community water system destroyed Road destroyed Utilities Damaged Precipitation 2012 Johnson’s Landing Increased Soil Moisture Decreased Soil Strength Landslide Impacts TMTV Source: Greg Utzig. www.kootenay resiliance.org

49
Athabasca Glacier Change in 88 years

50
Climate Change Impacts Continuing Rapid Recession of Alpine Glaciers Kokanee Glacier ice margin 2010 Approximate ice margins as of ca. 1870 Ice loss at Kokanee Glacier since ca. 1870

51
Climate Change Impacts Streamflows and Snowpack

52
Climate Change Impacts Water Supply: An Example from Kaslo

53
Climate change impacts & planning: Stormwater management The confluence of Ward and Baker – Nelson BC, 2012

54
Climate change impacts & planning Flood Risk and Extreme Events

55
Climate change impacts & planning: Interface Wildfire

56
From Dialogue to Action

57
The End

Similar presentations


![Climate Change Impacts in the United States Third National Climate Assessment [Name] [Date] Climate Trends.](/15/4626683/big_thumb.jpg "Climate Change Impacts in the United States Third National Climate Assessment [Name] [Date] Climate Trends.>")


 Initiatives Reduce greenhouse gas emissions. Reduce.>")
 2.Sea level rise and coastal flooding (melting ice and thermal expansion) 3.Expansion of tropical.>")


>")


