Download presentation
Presentation is loading. Please wait.

1
Centers for Disease Control and Prevention Morgantown, West Virginia June 20-24, 2011 Teach Epidemiology Professional Development Workshop Day 2

2
2

3
3 Teach Epidemiology

4
4

5
Identifying Patterns and Formulating Hypotheses 5

6
6 Drug Use Among Racial and Ethnic Minorities a.American Indian or Alaskan Native - A person having origins in any of the original peoples of North and South America, who maintains cultural identification through tribal affiliations or community recognition. b.Asian or Pacific Islander - A person having origins in any of the original peoples of the Far East, Southeast Asia, the Indian subcontinent, or the Pacific Islands. This area includes, for example, China, India, Japan, Korea, the Philippine Islands, Hawaii, and Samoa. c.Black or African American - A person having origins in any of the Black racial groups of Africa. d.Hispanic - A person of Mexican, Puerto Rican, Cuban, Central or South American or other Spanish culture or origin, regardless of race. e.White - A person having origins in any of the original peoples of Europe, North Africa, or the Middle East. Identifying Patterns and Formulating Hypotheses

7
7 Drug Use Among Racial and Ethnic Minorities a.American Indian or Alaskan Native - A person having origins in any of the original peoples of North and South America, who maintains cultural identification through tribal affiliations or community recognition. b.Asian or Pacific Islander - A person having origins in any of the original peoples of the Far East, Southeast Asia, the Indian subcontinent, or the Pacific Islands. This area includes, for example, China, India, Japan, Korea, the Philippine Islands, Hawaii, and Samoa. c.Black or African American - A person having origins in any of the Black racial groups of Africa. d.Hispanic - A person of Mexican, Puerto Rican, Cuban, Central or South American or other Spanish culture or origin, regardless of race. e.White - A person having origins in any of the original peoples of Europe, North Africa, or the Middle East. Identifying Patterns and Formulating Hypotheses

8
8 Enforcing the requirements of the Voting Rights Act Reviewing State redistricting plans Collecting and presenting population and population characteristics data, labor force data, education data, and vital and health statistics Establishing and evaluating Federal affirmative action plans and evaluating affirmative action and discrimination in employment in the private sector Monitoring the access of minorities to home mortgage loans under the Home Mortgage Disclosure Act Enforcing the Equal Credit Opportunity Act Monitoring and enforcing desegregation plans in the public schools Assisting minority businesses under the minority business development programs Enforcing the Fair Housing Act Ways the Federal Government Uses Race / Ethnicity Data Identifying Patterns and Formulating Hypotheses

9
9 Does race and ethnicity make a difference? Identifying Patterns and Formulating Hypotheses

10
10 Race / Ethnic Group Percent Estimate Prevalence of Use of Selected Drugs Among Persons Age 12 and Older in United States, 1998 Any Illegal Drug Use06.2 Marijuana05.0 Cocaine00.8 Alcohol51.7 Cigarettes27.7 Does race and ethnicity make a difference? Drug Used in Past Month Identifying Patterns and Formulating Hypotheses

11
11 Estimate Prevalence of Use of Any Illicit Drug Among Persons Age 12 and Older in United States, By Race and Ethnicity: 1998 White, Non-Hispanic 6.2 Black, Non-Hispanic 6.2 American Indian / Alaskan Native 6.2 Asian / Pacific Islander 6.2 Hispanic 6.2 6.2 Estimate Prevalence of Use of Selected Drugs Among Persons Age 12 and Older in United States: 1998 Any Illegal Drug Use06.2 Marijuana05.0 Cocaine00.8 Alcohol51.7 Cigarettes27.7 Drug Percent Used in Past Month Does race and ethnicity make a difference? Race / Ethnic Group Percent Used in Past Month

12
Identifying Patterns and Formulating Hypotheses 12 Estimate Prevalence of Use of Any Illicit Drug Among Persons Age 12 and Older in United States, By Race and Ethnicity: 1998 Does race and ethnicity make a difference? White, Non-Hispanic 6.2 Black, Non-Hispanic 6.2 American Indian / Alaskan Native 6.2 Asian / Pacific Islander 6.2 Hispanic 6.2 6.2 6.1 8.2 9.3 2.8 6.1 What hypotheses might explain this distribution? Estimate Prevalence of Use of Selected Drugs Among Persons Age 12 and Older in United States: 1998 Any Illegal Drug Use06.2 Marijuana05.0 Cocaine00.8 Alcohol51.7 Cigarettes27.7 Drug Percent Used in Past Month Race / Ethnic Group Percent Used in Past Month

13
Identifying Patterns and Formulating Hypotheses 13 Estimate Prevalence of Use of Marijuana Among Persons Age 12 and Older in United States, By Race and Ethnicity: 1998 Does race and ethnicity make a difference? White, Non-Hispanic 6.2 Black, Non-Hispanic 6.2 American Indian / Alaskan Native 6.2 Asian / Pacific Islander 6.2 Hispanic 6.2 Race / Ethnic Group Percent Used in Past Month 5.0 Estimate Prevalence of Use of Selected Drugs Among Persons Age 12 and Older in United States: 1998 Any Illegal Drug Use06.2 Marijuana05.0 Cocaine00.8 Alcohol51.7 Cigarettes27.7 Drug Percent Used in Past Month

14
Identifying Patterns and Formulating Hypotheses 14 Estimate Prevalence of Use of Marijuana Among Persons Age 12 and Older in United States, By Race and Ethnicity: 1998 Does race and ethnicity make a difference? White, Non-Hispanic 6.2 Black, Non-Hispanic 6.2 American Indian / Alaskan Native 6.2 Asian / Pacific Islander 6.2 Hispanic 6.2 Race / Ethnic Group Percent Used in Past Month 5.0 6.6 8.0 2.6 4.5 What hypotheses might explain this distribution? Estimate Prevalence of Use of Selected Drugs Among Persons Age 12 and Older in United States: 1998 Any Illegal Drug Use06.2 Marijuana05.0 Cocaine00.8 Alcohol51.7 Cigarettes27.7 Drug Percent Used in Past Month

15
Identifying Patterns and Formulating Hypotheses 15 Estimate Prevalence of Use of Cocaine Among Persons Age 12 and Older in United States, By Race and Ethnicity: 1998 Does race and ethnicity make a difference? White, Non-Hispanic 6.2 Black, Non-Hispanic 6.2 American Indian / Alaskan Native 6.2 Asian / Pacific Islander 6.2 Hispanic 6.2 Race / Ethnic Group Percent Used in Past Month 0.8 Estimate Prevalence of Use of Selected Drugs Among Persons Age 12 and Older in United States: 1998 Any Illegal Drug Use06.2 Marijuana05.0 Cocaine00.8 Alcohol51.7 Cigarettes27.7 Drug Percent Used in Past Month

16
Identifying Patterns and Formulating Hypotheses 16 Estimate Prevalence of Use of Cocaine Among Persons Age 12 and Older in United States, By Race and Ethnicity: 1998 Does race and ethnicity make a difference? White, Non-Hispanic 6.2 Black, Non-Hispanic 6.2 American Indian / Alaskan Native 6.2 Asian / Pacific Islander 6.2 Hispanic 6.2 Race / Ethnic Group Percent Used in Past Month 0.8 0.7 1.3 1.4 0.0 1.3 What hypotheses might explain this distribution? Estimate Prevalence of Use of Selected Drugs Among Persons Age 12 and Older in United States: 1998 Any Illegal Drug Use06.2 Marijuana05.0 Cocaine00.8 Alcohol51.7 Cigarettes27.7 Drug Percent Used in Past Month

17
Identifying Patterns and Formulating Hypotheses 17 Estimate Prevalence of Use of Alcohol Among Persons Age 12 and Older in United States, By Race and Ethnicity: 1998 Does race and ethnicity make a difference? White, Non-Hispanic 6.2 Black, Non-Hispanic 6.2 American Indian / Alaskan Native 6.2 Asian / Pacific Islander 6.2 Hispanic 6.2 Race / Ethnic Group Percent Used in Past Month 51.7 Estimate Prevalence of Use of Selected Drugs Among Persons Age 12 and Older in United States: 1998 Any Illegal Drug Use06.2 Marijuana05.0 Cocaine00.8 Alcohol51.7 Cigarettes27.7 Drug Percent Used in Past Month

18
Identifying Patterns and Formulating Hypotheses 18 Estimate Prevalence of Use of Alcohol Among Persons Age 12 and Older in United States, By Race and Ethnicity: 1998 Does race and ethnicity make a difference? White, Non-Hispanic 6.2 Black, Non-Hispanic 6.2 American Indian / Alaskan Native 6.2 Asian / Pacific Islander 6.2 Hispanic 6.2 Race / Ethnic Group Percent Used in Past Month 51.7 55.3 39.8 43.3 34.5 45.4 What hypotheses might explain this distribution? Estimate Prevalence of Use of Selected Drugs Among Persons Age 12 and Older in United States: 1998 Any Illegal Drug Use06.2 Marijuana05.0 Cocaine00.8 Alcohol51.7 Cigarettes27.7 Drug Percent Used in Past Month

19
Identifying Patterns and Formulating Hypotheses 19 Estimate Prevalence of Use of Cigarettes Among Persons Age 12 and Older in United States, By Race and Ethnicity: 1998 Does race and ethnicity make a difference? White, Non-Hispanic 6.2 Black, Non-Hispanic 6.2 American Indian / Alaskan Native 6.2 Asian / Pacific Islander 6.2 Hispanic 6.2 Race / Ethnic Group Percent Used in Past Month 27.7 Estimate Prevalence of Use of Selected Drugs Among Persons Age 12 and Older in United States: 1998 Any Illegal Drug Use06.2 Marijuana05.0 Cocaine00.8 Alcohol51.7 Cigarettes27.7 Drug Percent Used in Past Month

20
Identifying Patterns and Formulating Hypotheses 20 Estimate Prevalence of Use of Cigarettes Among Persons Age 12 and Older in United States, By Race and Ethnicity: 1998 Does race and ethnicity make a difference? White, Non-Hispanic 6.2 Black, Non-Hispanic 6.2 American Indian / Alaskan Native 6.2 Asian / Pacific Islander 6.2 Hispanic 6.2 Race / Ethnic Group Percent Used in Past Month 27.7 27.9 29.4 31.2 22.5 25.8 What hypotheses might explain this distribution? Estimate Prevalence of Use of Selected Drugs Among Persons Age 12 and Older in United States: 1998 Any Illegal Drug Use06.2 Marijuana05.0 Cocaine00.8 Alcohol51.7 Cigarettes27.7 Drug Percent Used in Past Month

21
Identifying Patterns and Formulating Hypotheses 21 Estimate Prevalence of Use of Marijuana Among Persons Age 12 and Older in United States, By Race and Ethnicity: 1998 Does race and ethnicity make a difference? White, Non-Hispanic 5.0 Black, Non-Hispanic 6.6 American Indian / Alaskan Native 8.0 Asian / Pacific Islander 2.6 Hispanic 4.5 Race / Ethnic Group Percent Used in Past Month Estimate Prevalence of Use of Selected Drugs Among Persons Age 12 and Older in United States: 1998 Any Illegal Drug Use06.2 Marijuana05.0 Cocaine00.8 Alcohol51.7 Cigarettes27.7 Drug Percent Used in Past Month

22
Identifying Patterns and Formulating Hypotheses 22 Estimate Prevalence of Use of Marijuana Among Persons Age 12 and Older in United States, By Race and Ethnicity: 1998 Does race and ethnicity make a difference? White, Non-Hispanic 5.0 Black, Non-Hispanic 6.6 American Indian / Alaskan Native 8.0 Asian / Pacific Islander 2.6 Hispanic 4.5 Race / Ethnic Group Percent Used in Past Month White, Non-Hispanic 5.0 Black, Non-Hispanic 6.6 American Indian / Alaskan Native 8.0 Asian / Pacific Islander 2.6 Hispanic 4.5 Estimate Prevalence of Use of Selected Drugs Among Persons Age 12 and Older in United States: 1998 Any Illegal Drug Use06.2 Marijuana05.0 Cocaine00.8 Alcohol51.7 Cigarettes27.7 Drug Percent Used in Past Month

23
Identifying Patterns and Formulating Hypotheses 23 Estimate Prevalence of Use of Marijuana Among Hispanic Persons Age 12 and Older in United States, By Race and Ethnicity: 1998 Does race and ethnicity make a difference? Puerto Rican Mexican Cuban Central American South American Other Race / Ethnic Group Percent Used in Past Month 4.5 Estimate Prevalence of Use of Marijuana Among Persons Age 12 and Older in United States, By Race and Ethnicity: 1998 White, Non-Hispanic Black, Non-Hispanic American Indian / Alaskan Native Asian / Pacific Islander Hispanic Race / Ethnic Group Percent Used in Past Month 5.0 6.6 8.0 2.6 4.5

24
Identifying Patterns and Formulating Hypotheses 24 Estimate Prevalence of Use of Marijuana Among Hispanic Persons Age 12 and Older in United States, By Race and Ethnicity: 1998 Does race and ethnicity make a difference? Puerto Rican Mexican Cuban Central American South American Other Race / Ethnic Group Percent Used in Past Month 4.5 5.6 4.5 2.1 3.2 2.1 3.4 What hypotheses might explain this distribution? Estimate Prevalence of Use of Marijuana Among Persons Age 12 and Older in United States, By Race and Ethnicity: 1998 White, Non-Hispanic Black, Non-Hispanic American Indian / Alaskan Native Asian / Pacific Islander Hispanic Race / Ethnic Group Percent Used in Past Month 5.0 6.6 8.0 2.6 4.5

25
25 Estimated Prevalence of Recent Illegal Drug Use by Race / Ethnicity: 1999-2000 White Black American Indian / Alaskan Native Asian / Pacific Islander Hispanic Hidden Data Identifying Patterns and Formulating Hypotheses

26
26 White Black American Indian / Alaskan Native Asian / Pacific Islander Hispanic Identifying Patterns and Formulating Hypotheses Estimated Prevalence of Recent Illegal Drug Use by Race / Ethnicity: 1999-2000

27
27 Hidden Data Identifying Patterns and Formulating Hypotheses Estimated Prevalence of Recent Illegal Drug Use by Race / Ethnicity: 1999-2000

28
28 What hypotheses might explain this distribution? Identifying Patterns and Formulating Hypotheses Estimated Prevalence of Recent Illegal Drug Use by Race / Ethnicity: 1999-2000

29
29 Fundamental Epidemiological Understandings

30
30 Time Check 8:15 AM

31
31

32
32 Teach Epidemiology

33
33 Time Check 9:15 AM

34
34

35
35 Teach Epidemiology

36
Teachers Team-Teaching Teachers (TTTT) Existing Lesson Team leads other workshop participants in a portion of a selected existing epidemiological lesson.
 Existing Lesson Team leads other workshop participants in a portion of a selected existing epidemiological lesson.")
37
37 They can then use that ability to think about their own thinking … to grasp how other people might learn. They know what has to come first, and they can distinguish between foundational concepts and elaborations or illustrations of those ideas. They realize where people are likely to face difficulties developing their own comprehension, and they can use that understanding to simplify and clarify complex topics for others, tell the right story, or raise a powerfully provocative question. Ken Bain, What the Best College Teachers Do Metacognition Teach Epidemiology Epi – Grades 6-12

38
38 Teach Epidemiology Enduring Epidemiological Understandings

39
39 Time Check 10:15 AM

40
40

41
41 Teach Epidemiology

42
42 Time Check 10:30 AM

43
43

44
44 Teach Epidemiology

45
Teachers Team-Teaching Teachers (TTT) Teach Existing Epidemiological Lessons (EL) (4 Groups) Team leads other workshop participants in a portion of a selected existing epidemiological lesson.
 Teach Existing Epidemiological Lessons (EL) (4 Groups) Team leads other workshop participants in a portion of a selected existing epidemiological lesson.")
46
46 They can then use that ability to think about their own thinking … to grasp how other people might learn. They know what has to come first, and they can distinguish between foundational concepts and elaborations or illustrations of those ideas. They realize where people are likely to face difficulties developing their own comprehension, and they can use that understanding to simplify and clarify complex topics for others, tell the right story, or raise a powerfully provocative question. Ken Bain, What the Best College Teachers Do Metacognition Teach Epidemiology Epi – Grades 6-12

47
47 Teach Epidemiology Enduring Epidemiological Understandings

48
48 Time Check 10:15 AM

49
49

50
50 Teach Epidemiology

51
View a News Item from an Epidemiological Perspective Team leads other workshop participants in the analysis of a news item from an epidemiological perspective. Teach Epidemiology Teachers Team-Teaching Teachers (TTT)
.")
52
52 They can then use that ability to think about their own thinking … to grasp how other people might learn. They know what has to come first, and they can distinguish between foundational concepts and elaborations or illustrations of those ideas. They realize where people are likely to face difficulties developing their own comprehension, and they can use that understanding to simplify and clarify complex topics for others, tell the right story, or raise a powerfully provocative question. Ken Bain, What the Best College Teachers Do Metacognition Teach Epidemiology Epi – Grades 6-12

53
53 Teach Epidemiology Enduring Epidemiological Understandings

54
54 Teach Epidemiology Enduring Epidemiological Understandings

55
55 Time Check Noon

56
56

57
57 Teach Epidemiology

58
58 Time Check 1:00 PM

59
59

60
60 Teach Epidemiology

61
Teach Epidemiology Workshop—Day 2 Diane Marie M. St. George, PhD University of MD School of Medicine

62
Back to EU 2 and 3 Why study patterns of disease? Why is a description of the person, place, and time elements of a disease distribution important?

63
Epidemiologic Studies Descriptive epidemiology Describes patterns of disease Suggests hypotheses about relationships between “exposures” and “health-related conditions” Analytic epidemiology Tests hypotheses Evaluates relationships Always in a search for causality Knowing causation helps us to prevent and treat disease and promote health

64
Enduring Understandings 4. A hypothesis can be tested by comparing the frequency of disease in selected groups of people with and without an exposure to determine if the exposure and the disease are associated. 5. When an exposure is hypothesized to have a beneficial effect, studies can be designed in which a group of people is intentionally exposed to the hypothesized cause and compared to a group that is not exposed. 6. When an exposure is hypothesized to have a detrimental effect, it is not ethical to intentionally expose a group of people. In these circumstances, studies can be designed that observe groups of free- living people with and without the exposure.

65
Boys are more likely than girls to want to go to this field trip. What are we comparing? Proportion of girls who will want to go on the trip to proportion of boys who will want to go on the trip. What is the causal inference? Gender Wanting to attend the field trip This “Teach Epi” thing…it will work better for Ms. Smith’s kids than mine. What are we comparing? Proportion of Smith’s students who will engage with epidemiology to proportion of my students who will engage with epidemiology. What is the causal inference? Class Engagement with the science of epidemiology

66
Heart attacks Descriptive epidemiology showed the following patterns: In certain Midwestern communities, increasing incidence of heart attacks over time More heart attacks among farmworkers than non- farmworkers in those communities More heart attacks among males than among females What is your hypothesis?

67
Testing hypotheses about MI Hypothesis: Exposure to pesticides increases risk of MI. How might you go about evaluating this hypothesis?

68
Testing hypotheses about MI Hypothesis: Exposure to pesticides increases risk of MI. Evaluate the hypothesis using an: Ecologic study

69
Ecologic study of pesticide exposure and MI Exposure is pesticide Measured as proportion of land area devoted to wheat Outcome is MI Measured as a rate per 100,000 Plot data on a graph What might you expect to see?

72
Ecologic Study Key element Group-level estimates Quantify relationships Graphical displays Correlation coefficient Advantages Study group-level variables, e.g. policies, laws, community socioeconomic status Use existing data sources Use fewer resources (time, money, subject burden) Disadvantage Ecologic fallacy
 Disadvantage Ecologic fallacy.")
73
Testing hypotheses about MI Hypothesis: Exposure to pesticides increases risk of MI. Evaluate the hypothesis using a: Cross-sectional study

74
Cross-sectional study of pesticide exposure and MI Exposure is pesticide Measured as pesticide application history Outcome is MI Measured as yes or no Count responses What might you expect to see?

75
Pesticides and MI MI+MI- Pesticide+ Pesticide- 200

76
Pesticides and MI MI+MI- Pesticide+6090150 Pesticide-104050 70130200 So, is pesticide usage associated with MI?

77
Pesticides and MI MI+MI- Pesticide+6090150 Pesticide-104050 70130200 What is the prevalence of MI? What is the prevalence of MI among pesticide users? What is the prevalence of MI among non-users?

78
Pesticides and MI MI+MI- Pesticide+6090150 Pesticide-104050 70130200 What is the prevalence of MI? 70/200 = 35% What is the prevalence of MI among pesticide users? = 60/150 = 40% What is the prevalence of MI among non-users? = 10/50 = 20%

79
Cross-sectional Study Key element Snapshot of one point in time Quantify association Prevalence ratio Advantages Individual data Quick, cheap Disadvantages Difficult to assess temporality because measure E and D simultaneously Inefficient for E or D that are rare Inefficient for D that are rapidly fatal or of short duration

80
Testing hypotheses about MI Hypothesis: Exposure to pesticides increases risk of MI. Evaluate the hypothesis using a: Case-control study

81
Case-control study of pesticide exposure and MI Exposure is pesticide Measured as pesticide application history Outcome is MI Measured as yes or no Want to ensure that you have enough cases to do your study, so select for those with MI Find those without MI Ask them about exposures to pesticides What might you expect to see?

82
Pesticides and MI MI+MI- Pesticide+ Pesticide- 100 200

83
Pesticides and MI MI+MI- Pesticide+601070 Pesticide-4090130 100 200 What is the prevalence of MI?

84
Case-control Study Odds = probability an event will occur/probability that an event will not occur Odds of exposure in cases = (among cases) probability of being exposed/probability one was not exposed What is odds of exposure in controls? = (among controls) probability of being exposed/ probability one was not exposed What is Odds Ratio?
 probability of being exposed/ probability one was not exposed What is Odds Ratio .")
85
Pesticides and MI MI+MI- Pesticide+601070 Pesticide-4090130 100 200 What is the odds of exposure among the cases? What is the odds of exposure among the controls? What is the OR?

86
Pesticides and MI MI+MI- Pesticide+601070 Pesticide-4090130 100 200 What is the odds of exposure among the cases? (60/100)/(40/100) = 60/40 = 1.5 What is the odds of exposure among the controls? (10/90) =.11 What is the OR? ~ 13.5
/(40/100) = 60/40 = 1.5 What is the odds of exposure among the controls. (10/90) =.11 What is the OR. ~")
87
Case-control Study Key elements Compare individuals selected on the basis of disease status Classic epidemiologic study design Quantify association Odds Ratio Advantages Can be less expensive and time-consuming than follow-up studies Efficient for rare diseases Disadvantages May be resource-intensive because of need to screen so many Difficult to assess temporality

88
Testing hypotheses about MI Hypothesis: Exposure to pesticides increases risk of MI. Evaluate the hypothesis using a: Cohort study

89
Cohort study of pesticide exposure and MI Exposure is pesticide Measured as pesticide application history Outcome is MI Measured as yes or no Want to ensure that you have enough exposed persons to do your study, so select for those with pesticide exposure Find those without pesticide exposure Follow them up over time to ascertain MI status What might you expect to see?

90
Pesticides and MI MI+MI- Pesticide+100 Pesticide-100 200

91
Pesticides and MI MI+MI- Pesticide+7030100 Pesticide-3565100 10595200 What is the incidence of MI among the pesticide users? What is the incidence of MI among the non-users? What is the risk ratio?

92
Pesticides and MI MI+MI- Pesticide+7030100 Pesticide-3565100 10595200 What is the incidence of MI among the pesticide users? = 70% What is the incidence of MI among the non-users? = 35% What is the risk ratio? = 2.0

93
Cohort Study Key element Select based on exposure status and follow-up over time Quantify association Relative risk (risk ratio) Advantages Minimizes confusion about temporality Ideal for rare exposures Disadvantages May have to screen many to get exposed group Large, time-consuming, expensive especially if disease is relatively rare and/or slow to develop Inefficient for rare diseases
 Advantages Minimizes confusion about temporality Ideal for rare exposures Disadvantages May have to screen many to get exposed group Large, time-consuming, expensive especially if disease is relatively rare and/or slow to develop Inefficient for rare diseases")
94
Testing hypotheses about MI Hypothesis: Exposure to pesticides increases risk of MI. Evaluate the hypothesis using a: Randomized controlled trial

95
RCT study of pesticide exposure and MI Exposure is pesticide Measured as pesticide exposure Outcome is MI Measured as yes or no Want to ensure maximal control over study parameters, so you decide who gets exposed and who does not Follow up over time to ascertain MI status What might you expect to see?

96
Pesticides and MI MI+MI- Pesticide+ Pesticide- 200

97
Pesticides and MI MI+MI- Pesticide+7030100 Pesticide-3565100 10595200 What is the incidence of MI among the pesticide users? What is the incidence of MI among the non-users? What is the risk ratio?

98
Pesticides and MI MI+MI- Pesticide+7030100 Pesticide-3565100 10595200 What is the incidence of MI among the pesticide users? = 70% What is the incidence of MI among the non-users? = 35% What is the risk ratio? = 2.0

99
Randomized Controlled Trial Key elements Assign treatments to individuals and follow up to ascertain disease status. The researcher controls primary exposure under study. Exposures can be treatments (drug, surgery) or preventive measures (water fluoridation, exercise regimens). Ethical considerations may preclude use of this design. Quantify association Relative risk (risk ratio) Advantages Random assignment serves to “equate” groups Closest to “true experiment” Disadvantages Expensive and time-consuming Subjects are often highly selected group because the requirements of participants can often be extensive
 or preventive measures (water fluoridation, exercise regimens). Ethical considerations may preclude use of this design. Quantify association Relative risk (risk ratio) Advantages Random assignment serves to equate groups Closest to true experiment Disadvantages Expensive and time-consuming Subjects are often highly selected group because the requirements of participants can often be extensive.")
101
Childhood cancer and residential electric consumption Canada 1971-1986 Rank provinces by REC Rank provinces by cancer rates: surveillance data What is exposure/risk factor/agent? What is disease/health outcome? What study design?

102
Ecologic Study r=0.74r=0.78 r=0.58r=0.44

103
Literacy and misunderstanding prescription drug labels Adults in primary care clinic waiting rooms Low literacy = reading at 5 th grade level or below Example: Take one tsp by mouth 3 times daily What is exposure? What is health outcome? What is study design?

104
Cross-sectional Study Misunderstand Amoxicillin label Understand label Low literacyAB Adequate literacy CD

105
Cross-sectional Study Misunderstand Amoxicillin label Understand label Low literacy314475 Adequate literacy 36171207 67215282 Please reproduce the 2X2 table on paper.

106
Cross-sectional Study What proportion of adults had low literacy? = 75/282 = 27% What proportion of adults misunderstood the labels? = 67/282 = 24% What proportion of adults who had low literacy misunderstood the labels? = 31/75 = 41% What proportion of adults with adequate literacy misunderstood the labels? =36/207 = 17% How did the misunderstanding of the low literate adults compare with that of the adequately literate adults? = 41%/17% = 2.4

107
Household pesticides and Wilms tumor Early age at onset suggests in utero exposures 523 cases of Wilms tumor 517 controls Pesticide use in home from month before conception through date of diagnosis/date of telephone call What is exposure? Health condition? Study design?

108
Case-control Study Wilms+Wilms- Pesticide in yard+ AB Pesticide in yard- CD

109
Case-control Study Wilms+Wilms- Pesticide in yard+ 158157 Pesticide in yard- 352344 510501 OR = (158/352)/(157/344) ≈ 1.0
/(157/344) ≈ 1.0")
110
HIV status and risk of menstrual abnormalities Women’s Interagency HIV Study ~2500 HIV+ and ~1300 HIV- women enrolled Ask about amenorrhea at baseline and follow-up What is exposure? health condition? study design?

111
Cohort Study AmenorrheaMenstrual period w/in past 6 mos HIV+1418931034 HIV-37346383 17812391417

112
Cohort study What is risk of amenorrhea among HIV+ women? = 141/1034 = 14% What is risk of amenorrhea among HIV- women? = 37/383 = 10% What is the risk among HIV+ women relative to the risk among HIV- women? Relative Risk = 1.4

113
Vitamin D supplementation and risk of falls and fractures among the elderly 149 residential facilities in Australia Randomly assigned to 2 years on calcium plus Vitamin D or placebo Double-masked Study diaries maintained by caregivers What is exposure? health condition? study design?

114
RCT Fall+Fall- Vitamin D supplement 170143 Placebo185127

115
RCT What is risk of falls among the treatment group? = 170/313 = 54% What is risk of falls among the comparison group? =185/312 = 59% What is RR? = 54%/59% = 0.9

116
Enduring Understandings 4. A hypothesis can be tested by comparing the frequency of disease in selected groups of people with and without an exposure to determine if the exposure and the disease are associated. 5. When an exposure is hypothesized to have a beneficial effect, studies can be designed in which a group of people is intentionally exposed to the hypothesized cause and compared to a group that is not exposed. 6. When an exposure is hypothesized to have a detrimental effect, it is not ethical to intentionally expose a group of people. In these circumstances, studies can be designed that observe groups of free- living people with and without the exposure.

117
117 Time Check 2:45 PM

118
118

119
119 Teach Epidemiology

120
120 Time Check 3:00 PM

121
121

122
122 Teach Epidemiology

123
123 Ecologic Study Study in which the units investigated are populations or groups of people rather than individuals.

124
124 Ecologic Study

125
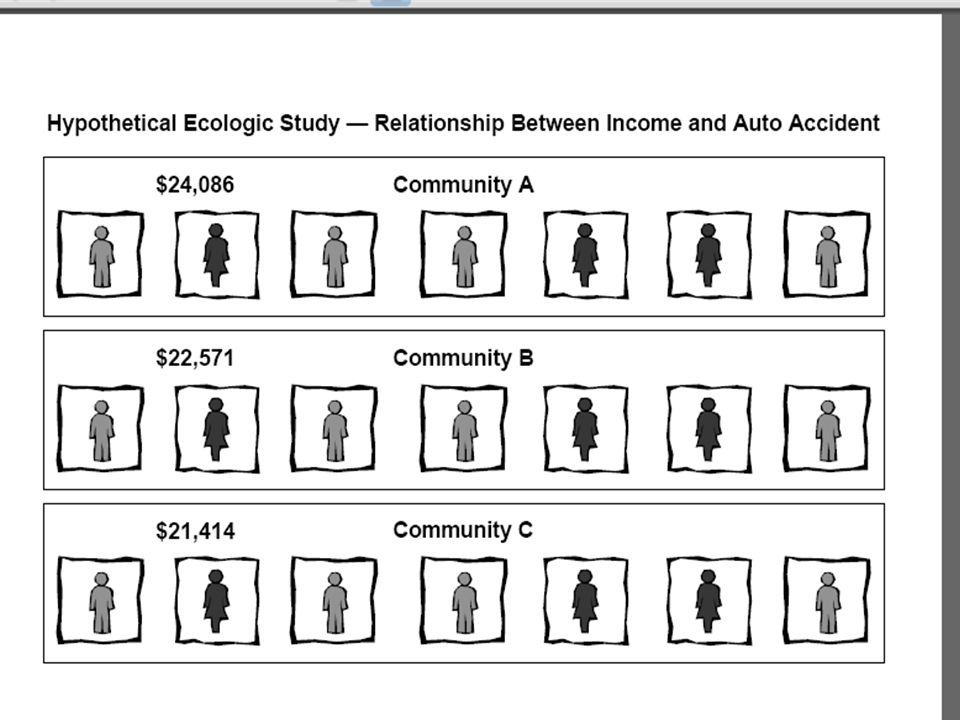
Hypothetical Ecologic Study Relationship Between Income and Auto Accident 3 communities each with a population of 7 people This hypothetical ecologic study is described in AV Diez-Roux’s article, “Bringing Context Back into Epidemiology: Variables and Fallacies in Multilevel Analysis,” in the American Journal of Public Health, 1998;88:216–222.

132
132 Ecologic Study Ecological Fallacy An error in inference due to failure to distinguish between information obtained from groups versus individuals. An association observed between variables at a population level does not necessarily hold true for individual members of these populations.

136
136 Ecologic Study Ecological Fallacy An error in inference due to failure to distinguish between information obtained from groups versus individuals. An association observed between variables at a population level does not necessarily hold true for individual members of these populations.

138
138 Outcome +- + - Exposure a c b d Ecologic Study

139
139

140
Which came first? EggChicken Detectives in the Classroom – Investigation 3-5: Reversed Time Order

141
141 Which happened first?

142
142

143
143 Random Assignment

144
144 Random Assignment

145
145

146
146

147
147

148
148

149
149

150
150 National Research Council, Learning and Understanding Teach Epidemiology Enduring Epidemiological Understandings Knowledge that “… is connected and organized, and … ‘conditionalized’ to specify the context in which it is applicable.”

151
151 Association Found Between Coffee and Pancreatic Cancer Associated Teach Epidemiology

152
152 What do we mean when we say that there is an association between two things? Associated TiedRelated Linked Things that are associated are linked in some way that makes them turn up together. Associated Teach Epidemiology

153
153 Things that are associated are linked in some way that makes them turn up together. Associated Teach Epidemiology

154
154 Suicide Higher in Areas with Guns Smoking Linked to Youth Eating Disorders Snacks Key to Kids’ TV- Linked Obesity: China Study Family Meals Are Good for Mental Health Lack of High School Diploma Tied to US Death Rate Study Links Spanking to Aggression Breakfast Each Day May Keep Colds Away Study Concludes: Movies Influence Youth Smoking Study Links Iron Deficiency to Math Scores Kids Who Watch R-Rated Movies More Likely to Drink, Smoke Pollution Linked with Birth Defects in US Study Depressed Teens More Likely to Smoke Associated Teach Epidemiology

155
155 Epidemiologic studies that are concerned with characterizing the amount and distribution of health and disease within a population. Descriptive Epidemiology Teach Epidemiology

156
156 Epidemiologic studies that are concerned with determinants of disease and the reasons for relatively high or low frequencies of disease in specific population subgroups. Analytical Epidemiology Teach Epidemiology

157
157 Hypothesis Formulating Descriptive Epidemiology Testing Analytical Epidemiology An unproven idea, based on observation or reasoning, that can be supported or refuted through investigation An educated guess Hypothesis Teach Epidemiology

158
158 Hypothesis: Buprenorphine will stop heroin addicts from using heroin. Making Group Comparisons and Identifying Associations Teach Epidemiology

159
159 Population Trial 1 Making Group Comparisons and Identifying Associations

160
160 Population 500 Heroin Addicts Sample 100 Heroin Addicts 10 Weeks Trial 1 Making Group Comparisons and Identifying Associations

161
161 Population 500 Heroin Addicts Sample 100 Heroin Addicts 10 Weeks 21 Heroin Addicts Tested Negative for Heroin Trial 1 Making Group Comparisons and Identifying Associations

162
162 Bupe Tested Positive for Heroin Total 1002179 Tested Negative for Heroin Trial 1 Making Group Comparisons and Identifying Associations Teach Epidemiology

163
163 When you can measure what you are speaking about, and express it in numbers, you know something about it. Lord Kelvin But when you cannot measure it, when you cannot express it in numbers, your knowledge is of a meager and unsatisfactory kind. Making Group Comparisons and Identifying Associations Teach Epidemiology

164
164 A measure of how often an outcome occurs in a defined population in a defined period of time. It consists of a numerator and a denominator. Risk The numerator is the number of people in the population or sample who experienced the outcome and the denominator is the total number of people in the population or sample. Population / Sample Outcome Denominator Numerator Making Group Comparisons and Identifying Associations Teach Epidemiology

165
165 … the risk of a negative heroin test was 21 / 100 in a 10-week period 21 tested negative for heroin 100 study subjects Numerator Denominator Risk Making Group Comparisons and Identifying Associations Teach Epidemiology

166
166 A measure of how often an outcome occurs in a defined group of people in a defined period of time. The likelihood of an outcome occurring. Risk / Rate Making Group Comparisons and Identifying Associations Teach Epidemiology

167
167 Trial 1 Bupe Tested Positive for Heroin 1002179 Tested Negative for Heroin 21 100 or 21 % Calculating Risk Risk of Negative Heroin Test Total Making Group Comparisons and Identifying Associations Teach Epidemiology

168
168 Process of predicting from what is observed in a sample to what is true for the entire population. Inference Making Group Comparisons and Identifying Associations Teach Epidemiology

169
169 Trial 1 What does this tell you about the hypothesis? Buprenorphine will stop heroin addicts from using heroin. Inference Probe Bupe Tested Positive for Heroin 1002179 Tested Negative for Heroin 21 100 or 21 % Risk of Negative Heroin Test Total Making Group Comparisons and Identifying Associations Teach Epidemiology

170
170 People who participate in a trial, but do not get the treatment. People whose results are compared to the group that was treated. Control Group Making Group Comparisons and Identifying Associations Teach Epidemiology

171
171 21 100 or 21 % 1007921 Tested Positive for Heroin Tested Negative for Heroin Bupe Control Group Extend and label the table to include a control group. Risk of Negative Heroin Test Total Making Group Comparisons and Identifying Associations Teach Epidemiology

172
172 100 ? or ? % No Bupe Control Group Making Group Comparisons 21 100 or 21 % 1007921 Tested Positive for Heroin Tested Negative for Heroin Bupe Risk of Negative Heroin Test Total Making Group Comparisons and Identifying Associations Teach Epidemiology

173
173 100 ? or ? % No Bupe Making Group Comparisons 21 100 or 21 % 1007921 Tested Positive for Heroin Tested Negative for Heroin Bupe ExposureExposure Outcome / Disease ab cd Risk of Negative Heroin Test Total Making Group Comparisons and Identifying Associations Teach Epidemiology

174
174 21 100 or 21 % Total 1007921 Bupe 100 ? or ? % No Bupe Tested Negative for Heroin Tested Positive for Heroin Risk of Negative Heroin Test Making Group Comparisons and Identifying Associations Teach Epidemiology

175
175 A cross-classification of data where categories of one variable are presented in rows and categories of another variable are presented in columns The simplest contingency table is the 2x2 table. Contingency Table Making Group Comparisons and Identifying Associations Teach Epidemiology

176
176 Population 500 Heroin Addicts Sample 100 Heroin Addicts 10 Weeks 21 Heroin Addicts Tested Negative for Heroin Trial 1 Making Group Comparisons and Identifying Associations

177
177 Trial 2 Total ? 100 ? % a b c d Bupe Tested Negative for Heroin Tested Positive for Heroin No Bupe100 ? ? % Risk of Negative Heroin Test Making Group Comparisons and Identifying Associations Teach Epidemiology

178
178 E Assigned E O O O O Making Group Comparisons and Identifying Associations Volunteer Heroin Addicts Teach Epidemiology

179
179 21 100 21% 2179100 or a b c d Bupe Trial 2 No Bupe Probe Total Tested Negative for Heroin Tested Positive for Heroin Risk of Negative Heroin Test Making Group Comparisons and Identifying Associations Teach Epidemiology

180
180 21 100 21% 2179100 or a b c d Bupe Trial 2 No Bupe Total Tested Negative for Heroin Tested Positive for Heroin Risk of Negative Heroin Test 21 100 21% 2179100 or Making Group Comparisons and Identifying Associations Teach Epidemiology

181
181 21 100 21% 2179100 or a b c d Bupe Trial 2 No Bupe Total Tested Negative for Heroin Tested Positive for Heroin Risk of Negative Heroin Test 21 100 21% 2179100 or Inference: Process of predicting from what is observed in a sample to what is occurring in the entire population Making Group Comparisons and Identifying Associations Teach Epidemiology

182
182 When you can measure what you are speaking about, and express it in numbers, you know something about it. Lord Kelvin But when you cannot measure it, when you cannot express it in numbers, your knowledge is of a meager and unsatisfactory kind. Making Group Comparisons and Identifying Associations Teach Epidemiology

183
183 The value obtained by dividing one quantity by another Ratio Making Group Comparisons and Identifying Associations Teach Epidemiology

184
184 21 100 21% 2179100 or a b c d Bupe Trial 2 No Bupe Total Tested Negative for Heroin Tested Positive for Heroin Risk of Negative Heroin Test 21 100 21% 2179100 or Ratio: The value obtained by dividing one quantity by another Risk Ratio: The ratio of two risks 1 Risk Ratio Making Group Comparisons and Identifying Associations Teach Epidemiology

185
185 21 100 21% 2179100 or a b c d Bupe Trial 2 No Bupe Total Tested Negative for Heroin Tested Positive for Heroin Risk of Negative Heroin Test 21 100 21% 2179100 or Ratio: The value obtained by dividing one quantity by another Risk Ratio: The ratio of two risks 1 Risk Ratio Create a formula a a + b c c + d Making Group Comparisons and Identifying Associations Teach Epidemiology

186
186 21 100 21% 2179100 or a b c d Bupe Trial 2 No Bupe Total Tested Negative for Heroin Tested Positive for Heroin Risk of Negative Heroin Test 21 100 21% 2179100 or 1 Risk Ratio Relative Risk: The ratio of the risk of an outcome among the exposed to the risk of the outcome among the unexposed. Relative Risk Making Group Comparisons and Identifying Associations Teach Epidemiology

187
187 21 100 21% 2179100 or a b c d Bupe Trial 2 No Bupe Total Tested Negative for Heroin Tested Positive for Heroin Risk of Negative Heroin Test 21 100 21% 2179100 or 1 Risk Ratio Relative Risk Inference: Process of predicting from what is observed in a sample to what is occurring in the entire population The inference here is that there is no effect of Buprenorphine Making Group Comparisons and Identifying Associations Teach Epidemiology

188
188 Trial 3 ? 100 ? % 100 or a b c d Bupe No Bupe Total Tested Negative for Heroin Tested Positive for Heroin Risk of Negative Heroin Test ? 100 ? % 100 or Making Group Comparisons and Identifying Associations Teach Epidemiology

189
189 21 100 21% 2179100 or a b c d Bupe No Bupe Total Tested Negative for Heroin Tested Positive for Heroin Risk of Negative Heroin Test Trial 3 Making Group Comparisons and Identifying Associations Teach Epidemiology

190
190 21 100 21% 2179100 or a b c d Bupe No Bupe Total Tested Negative for Heroin Tested Positive for Heroin Risk of Negative Heroin Test 62 100 62% 6238100 or Trial 3 Making Group Comparisons and Identifying Associations Teach Epidemiology

191
191 21 100 21% 2179100 or a b c d Bupe No Bupe Total Tested Negative for Heroin Tested Positive for Heroin Risk of Negative Heroin Test 62 100 62% 6238100 or Inference: Process of predicting from what is observed in a sample to what is occurring in the entire population Trial 3 Making Group Comparisons and Identifying Associations Teach Epidemiology

192
192 21 100 21% 2179100 or a b c d Bupe No Bupe Total Tested Negative for Heroin Tested Positive for Heroin Risk of Negative Heroin Test 62 100 62% 6238100 or Relative Risk Relative Risk: The ratio of the risk of an outcome among the exposed to the risk of the outcome among the unexposed. 0.34 Trial 3 Making Group Comparisons and Identifying Associations Teach Epidemiology

193
193 21 100 21% 2179100 or a b c d Bupe No Bupe Total Tested Negative for Heroin Tested Positive for Heroin Risk of Negative Heroin Test 62 100 62% 6238100 or Relative Risk 0.34 The heroin addicts who received Bupe were ___ times as likely to test negative for heroin as those who did not receive Bupe. 0.34 Trial 3 Making Group Comparisons and Identifying Associations Teach Epidemiology

194
194 21 100 21% 2179100 or a b c d Bupe No Bupe Total Tested Negative for Heroin Tested Positive for Heroin Risk of Negative Heroin Test 62 100 62% 6238100 or Relative Risk 0.34 Inference: Process of predicting from what is observed in a sample to what is occurring in the entire population. Trial 3 Making Group Comparisons and Identifying Associations Teach Epidemiology

195
195 Trial 4 ? 100 ? % 100 or a b c d Bupe No Bupe Total Tested Negative for Heroin Tested Positive for Heroin Risk of Negative Heroin Test ? 100 ? % 100 or Making Group Comparisons and Identifying Associations Teach Epidemiology

196
196 21 100 21% 2179100 or a b c d Bupe No Bupe Total Tested Negative for Heroin Tested Positive for Heroin Risk of Negative Heroin Test Trial 4 Making Group Comparisons and Identifying Associations Teach Epidemiology

197
197 21 100 21% 2179100 or a b c d Bupe No Bupe Total Tested Negative for Heroin Tested Positive for Heroin Risk of Negative Heroin Test 6 100 6% 694100 or Trial 4 Making Group Comparisons and Identifying Associations Teach Epidemiology

198
198 21 100 21% 2179100 or a b c d Bupe No Bupe Total Tested Negative for Heroin Tested Positive for Heroin Risk of Negative Heroin Test 6 100 6% 694100 or Relative Risk Relative Risk: The ratio of the risk of an outcome among the exposed to the risk of the outcome among the unexposed. 3.5 Trial 4 Making Group Comparisons and Identifying Associations Teach Epidemiology

199
199 21 100 21% 2179100 or a b c d Bupe No Bupe Total Tested Negative for Heroin Tested Positive for Heroin Risk of Negative Heroin Test 6 100 6% 694100 or Relative Risk 3.5 The heroin addicts who received Bupe were ___ times as likely to test negative for heroin as those who did not receive Bupe. 3.5 Trial 4 Making Group Comparisons and Identifying Associations Teach Epidemiology

200
200 21 100 21% 2179100 or a b c d Bupe No Bupe Total Tested Negative for Heroin Tested Positive for Heroin Risk of Negative Heroin Test 6 100 6% 694100 or Relative Risk 3.5 Inference: Process of predicting from what is observed in a sample to what is occurring in the entire population. Trial 4 Making Group Comparisons and Identifying Associations Teach Epidemiology

201
201 21 100 21% 2179100 or Bupe Trial 1 Total Tested Negative for Heroin Tested Positive for Heroin Risk of Negative Heroin Test What do the results tell us about the hypothesis that Buprenorphine will stop heroin addicts from using heroin? Nothing Making Group Comparisons and Identifying Associations Teach Epidemiology

202
202 Trial 1 Trial 2 Trial 3 Trial 4 Making Group Comparisons and Identifying Associations Teach Epidemiology

203
203 Nothing Bupe Total Trial 1 Trial 2 Trial 3 Trial 4 Risk of Negative Heroin Test Tested Negative for Heroin Tested Positive for Heroin 1002179 90 or 21% 21 100 Making Group Comparisons and Identifying Associations Teach Epidemiology

204
204 Risk of Negative Heroin Test Nothing Bupe Total Trial 1 Trial 2 Trial 3 Trial 4 Bupe No Bupe Bupe No Bupe Bupe Total Relative Risk No Bupe Total Relative Risk Total Tested Negative for Heroin Tested Positive for Heroin Relative Risk Risk of Negative Heroin Test Tested Negative for Heroin Tested Positive for Heroin Risk of Negative Heroin Test Tested Negative for Heroin Tested Positive for Heroin Risk of Negative Heroin Test Tested Negative for Heroin Tested Positive for Heroin 1002179 90 or 21% 21 100 Making Group Comparisons and Identifying Associations Teach Epidemiology

205
205 Risk of Negative Heroin Test Nothing Bupe Total Trial 1 Trial 2 Trial 3 Trial 4 Bupe No Bupe Bupe No Bupe Bupe Total Relative Risk No Bupe Total Relative Risk Total Tested Negative for Heroin Tested Positive for Heroin Relative Risk Risk of Negative Heroin Test Tested Negative for Heroin Tested Positive for Heroin Risk of Negative Heroin Test Tested Negative for Heroin Tested Positive for Heroin Risk of Negative Heroin Test Tested Negative for Heroin Tested Positive for Heroin 1002179 90 or 21% 21 100 2179 90 or 21% 21 100 2179 90 or 21% 21 100 2179 90 or 21% 21 100 Making Group Comparisons and Identifying Associations Teach Epidemiology

206
206 Risk of Negative Heroin Test Nothing Bupe Total Trial 1 Trial 2 Trial 3 Trial 4 Bupe No Bupe Bupe No Bupe Bupe Total Relative Risk No Bupe Total Relative Risk Total Tested Negative for Heroin Tested Positive for Heroin Relative Risk Risk of Negative Heroin Test Tested Negative for Heroin Tested Positive for Heroin Risk of Negative Heroin Test Tested Negative for Heroin Tested Positive for Heroin Risk of Negative Heroin Test Tested Negative for Heroin Tested Positive for Heroin 1002179 90 or 21% 21 100 2179 90 or 21% 21 100 2179 90 or 21% 21 100 2179 90 or 21% 21 100 2179 90 or 21% 21 100 1 Bupe is not associated with having a negative test for heroin. Making Group Comparisons and Identifying Associations Teach Epidemiology

207
207 Risk of Negative Heroin Test Nothing Bupe Total Trial 1 Trial 2 Trial 3 Trial 4 Bupe No Bupe Bupe No Bupe Bupe Total Relative Risk No Bupe Total Relative Risk Total Tested Negative for Heroin Tested Positive for Heroin Relative Risk Risk of Negative Heroin Test Tested Negative for Heroin Tested Positive for Heroin Risk of Negative Heroin Test Tested Negative for Heroin Tested Positive for Heroin Risk of Negative Heroin Test Tested Negative for Heroin Tested Positive for Heroin 1002179 90 or 21% 21 100 2179 90 or 21% 21 100 2179 90 or 21% 21 100 2179 90 or 21% 21 100 2179 90 or 21% 21 100 Bupe is not associated with having a negative test for heroin. 1 1006238 90 or 62% 62 100 Bupe is associated with having a positive test for heroin!.34 Making Group Comparisons and Identifying Associations Teach Epidemiology

208
208 Risk of Negative Heroin Test Nothing Bupe Total Trial 1 Trial 2 Trial 3 Trial 4 Bupe No Bupe Bupe No Bupe Bupe Total Relative Risk No Bupe Total Relative Risk Total Tested Negative for Heroin Tested Positive for Heroin Relative Risk Risk of Negative Heroin Test Tested Negative for Heroin Tested Positive for Heroin Risk of Negative Heroin Test Tested Negative for Heroin Tested Positive for Heroin Risk of Negative Heroin Test Tested Negative for Heroin Tested Positive for Heroin 1002179 90 or 21% 21 100 2179 90 or 21% 21 100 2179 90 or 21% 21 100 2179 90 or 21% 21 100 2179 90 or 21% 21 100 Bupe is not associated with having a negative test for heroin. 1 1006238 90 or 62% 62 100 Bupe is associated with having a positive test for heroin!.34 100694 90 or 6% 6 100 Bupe is associated with having a negative test for heroin. 3.5 Making Group Comparisons and Identifying Associations Teach Epidemiology

209
209 Risk of Negative Heroin Test Nothing Bupe Total Trial 1 Trial 2 Trial 3 Trial 4 Bupe No Bupe Bupe No Bupe Bupe Total Relative Risk No Bupe Total Relative Risk Total Tested Negative for Heroin Tested Positive for Heroin Relative Risk Risk of Negative Heroin Test Tested Negative for Heroin Tested Positive for Heroin Risk of Negative Heroin Test Tested Negative for Heroin Tested Positive for Heroin Risk of Negative Heroin Test Tested Negative for Heroin Tested Positive for Heroin 1002179 90 or 21% 21 100 2179 90 or 21% 21 100 2179 90 or 21% 21 100 2179 90 or 21% 21 100 2179 90 or 21% 21 100 Bupe is not associated with having a negative test for heroin. 1 1006238 90 or 62% 62 100 Bupe is associated with having a positive test for heroin!.34 100694 90 or 6% 6 100 Bupe is associated with having a negative test for heroin. 3.5 Nothing Compared to what? Making Group Comparisons and Identifying Associations Teach Epidemiology

210
210 Buprenorphine Buprenorphine & Naloxone Placebo Making Group Comparisons and Identifying Associations Teach Epidemiology Handout

211
211 National Research Council, Learning and Understanding Teach Epidemiology Enduring Epidemiological Understandings Knowledge that “… is connected and organized, and … ‘conditionalized’ to specify the context in which it is applicable.”

212
212

213
213 Suicide Higher in Areas with Guns Smoking Linked to Youth Eating Disorders Snacks Key to Kids’ TV- Linked Obesity: China Study Family Meals Are Good for Mental Health Lack of High School Diploma Tied to US Death Rate Study Links Spanking to Aggression Breakfast Each Day May Keep Colds Away Study Concludes: Movies Influence Youth Smoking Study Links Iron Deficiency to Math Scores Kids Who Watch R-Rated Movies More Likely to Drink, Smoke Pollution Linked with Birth Defects in US Study Depressed Teens More Likely to Smoke In the News

214
214 Total ab dc 2 x 2 Table Suicide Higher in Areas with Guns

215
215 Total ab dc People who are exposed ab 2 x 2 Table Suicide Higher in Areas with Guns Areas with Guns No Suicide Suicide Areas without Guns

216
216 ab dc 2 x 2 Table Total Kids Who Watch R-Rated Movies More Likely to Drink, Smoke

217
217 ab dc 2 x 2 Table R-Rated Movies Total Drink & Smoke Kids Who Watch R-Rated Movies More Likely to Drink, Smoke No Drink & Smoke No R-Rated Movies

218
218 ab dc People who are exposed and have the outcome a 2 x 2 Table R-Rated Movies Total Drink & Smoke Kids Who Watch R-Rated Movies More Likely to Drink, Smoke No Drink & Smoke No R-Rated Movies

219
219 ab dc 2 x 2 Table Family Meals Are Good for Mental Health Total

220
220 ab dc 2 x 2 Table Family Meals Are Good for Mental Health Family Meals Total Mental Health No Mental Health No Family Meals

221
221 ab dc People who are not exposed and do not have the outcome d 2 x 2 Table Family Meals Are Good for Mental Health Family Meals Total Mental Health No Mental Health No Family Meals

222
222 ab dc 2 x 2 Table Study Links Iron Deficiency to Math Scores Total

223
223 ab dc 2 x 2 Table Study Links Iron Deficiency to Math Scores Iron Deficiency Poor Math Scores No Iron Deficiency Good Math Scores Total

224
224 ab dc People who do not have the outcome and are not exposed d 2 x 2 Table Study Links Iron Deficiency to Math Scores Iron Deficiency Poor Math Scores No Iron Deficiency Good Math Scores Total

225
225 ab dc 2 x 2 Table Pollution Linked with Birth Defects in US Study Total

226
226 ab dc 2 x 2 Table Pollution Linked with Birth Defects in US Study Pollution Birth Defects No Pollution No Birth Defects Total

227
227 ab dc People who are not exposed dc 2 x 2 Table Pollution Linked with Birth Defects in US Study Pollution Birth Defects No Pollution No Birth Defects Total

228
228 ab dc 2 x 2 Table Depressed Teens More Likely to Smoke Total

229
229 ab dc People who do not have the outcome d b 2 x 2 Table Depressed Teens More Likely to Smoke Depression Smoke No Depression No Smoke Total

230
230 ab dc 2 x 2 Table Smoking Linked to Youth Eating Disorders Total

231
231 ab dc 2 x 2 Table Smoking Linked to Youth Eating Disorders Smoke Eating Disorders No Smoke No Eating Disorders Total

232
232 ab dc People who are exposed and do not have the outcome b 2 x 2 Table Smoking Linked to Youth Eating Disorders Smoke Eating Disorders No Smoke No Eating Disorders Total

233
233 ab dc 2 x 2 Table Total Study Links Spanking to Aggression

234
234 ab dc People who have the outcome a c 2 x 2 Table Study Links Spanking to Aggression Spanking Aggression No Spanking Total No Aggression

235
235 ab dc 2 x 2 Table Total Snacks Key to Kids’ TV-Linked Obesity – China Study

236
236 ab dc 2 x 2 Table Snacks Key to Kids’ TV-Linked Obesity – China Study Snacks Obesity No Snacks No Obesity Total People who are not exposed and have the outcome c

237
237

238
238 National Research Council, Learning and Understanding Teach Epidemiology Enduring Epidemiological Understandings Knowledge that “… is connected and organized, and … ‘conditionalized’ to specify the context in which it is applicable.”

239
239 Laboratory Teach Epidemiology Making Group Comparisons and Identifying Associations

240
240 Laboratory Teach Epidemiology Making Group Comparisons and Identifying Associations

241
241 Naturally occurring circumstances in which groups of people within a population have been exposed to different levels of the hypothesized cause of an outcome. Natural Experiment Teach Epidemiology Making Group Comparisons and Identifying Associations

242
242 An epidemiologic study of a natural experiment in which the investigator is not involved in the intervention other than to record, classify, count, and statistically analyze results. Observational Study Teach Epidemiology Making Group Comparisons and Identifying Associations

243
243 An epidemiologic experiment in which subjects are assigned into groups to receive or not receive a hypothesized beneficial intervention. Controlled Trial Teach Epidemiology Making Group Comparisons and Identifying Associations

244
244 Buprenorphine Buprenorphine will stop heroin addicts from using heroin. Teach Epidemiology Making Group Comparisons and Identifying Associations

245
245 Naturally occurring circumstances in which groups of people within a population have been exposed to different levels of the hypothesized cause of an outcome. Observational Study of a Natural Experiment Epidemiologic studies of natural experiments in which the investigator is not involved in the intervention other than to record, classify, count, and statistically analyze results. Teach Epidemiology Making Group Comparisons and Identifying Associations

246
246 Making Group Comparisons and Identifying Associations Teach Epidemiology

247
247 Making Group Comparisons and Identifying Associations Teach Epidemiology

248
248 Stephen Jay Gould (survivor of abdominal mesothelioma) Absolutely nothing in the available arsenal of anti-emetics worked at all. I was miserable and came to dread the frequent treatments with an almost perverse intensity. I had heard that marijuana often worked well against nausea. I was reluctant to try it because I had never smoked any substance habitually (and didn’t even know how to inhale). Moreover, I had tried marijuana twice (in the 1960s) … and had hated it …. Marijuana worked like a charm …. The sheer bliss of not experiencing nausea - and not having to fear it for all the days intervening between treatments - was the greatest boost I received in all my year of treatment, and surely the most important effect upon my eventual cure. Making Group Comparisons and Identifying Associations Teach Epidemiology
. Moreover, I had tried marijuana twice (in the 1960s) … and had hated it …. Marijuana worked like a charm …. The sheer bliss of not experiencing nausea - and not having to fear it for all the days intervening between treatments - was the greatest boost I received in all my year of treatment, and surely the most important effect upon my eventual cure. Making Group Comparisons and Identifying Associations Teach Epidemiology.")
249
249 A particular or detached incident or fact of an interesting nature; a biographical incident or fragment; a single passage of private life. Anecdote Making Group Comparisons and Identifying Associations Teach Epidemiology

250
250 Science Transforming Anecdote to Science Making Group Comparisons and Identifying Associations Teach Epidemiology Anecdote

251
251 Time ++++++++++++++++++++++++++++++++++++++++++++++++++++++++++ Healthy People - E Random Assignment E DZ Controlled Trial Time ++++++++++++++++++++++++++++++++++++++++++++++++++++++++++ Healthy People - E E DZ Cohort Study Time ++++++++++++++++++++++++++++++++++++++++++++++++++++++++++ Case-Control Study - DZ E E E E Time ++++++++++++++++++++++++++++++++++++++++++++++++++++++++++ Cross-Sectional Study - E E DZ Making Group Comparisons and Identifying Associations Teach Epidemiology

252
252 Time ++++++++++++++++++++++++++++++++++++++++++++++++++++++++++ Healthy People - E Random Assignment E DZ Controlled Trial Time ++++++++++++++++++++++++++++++++++++++++++++++++++++++++++ Healthy People - E E DZ Cohort Study Time ++++++++++++++++++++++++++++++++++++++++++++++++++++++++++ Case-Control Study - DZ E E E E Time ++++++++++++++++++++++++++++++++++++++++++++++++++++++++++ Cross-Sectional Study - E E DZ d b c a Making Group Comparisons and Identifying Associations Teach Epidemiology

253
The goal of every epidemiological study is to harvest valid and precise information about the relationship between an exposure and a disease in a population. The various study designs merely represent different ways of harvesting this information. Essentials in Epidemiology in Public Health Ann Aschengrau and George R. Seage III Making Group Comparisons and Identifying Associations Teach Epidemiology

254
254 Time Check 4:00 PM

Similar presentations


 American Indian or Alaska Native: A person having origins in any of the original peoples of North.>")


: Is there an association between.>")


 ASSISTANT PROFESSOR>")

: Is there an association.>")
