Download presentation
Presentation is loading. Please wait.

4
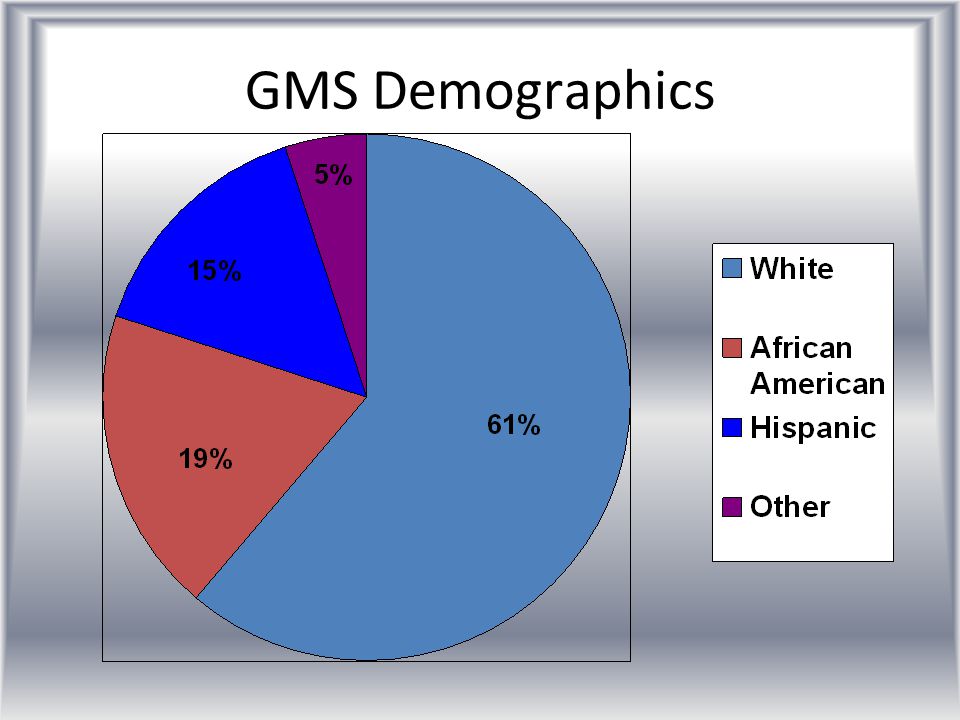
GMS Demographics

5
GMS Economically Disadvantaged 65%

6
GMS 2012 STAAR Average Raw Scores Average Raw Score Average Raw Score % 6 th 32/5262% 7 th 31/5457% 8 th 36/5664%

7
GMS TAKS Passing Progression

8
Closing the Achievement Gap

9
A majority of what we do in the class room has been picked up through our years of attending workshops, conferences, and internet searches. We have modified to fit the needs of our teachers and school. We thank all of you who contributed by allowing us to take and extend your ideas.

10
Arrays Model Fractions Calculate perimeter & Area Identify equivalent fractions with scale factor Perform the 4 computations

11
Arrays

13
2d & 3d figures & Measurement Chick peas and toothpicks Nets 6 steps for Volume (7 steps for pyramids and cones) 1.Identify the figure 2.Identify the shape of the base 3.Calculate the area of the base 4.Identify the height 5.Multiply the area of the base by the height 6.Label 7.For pyramids and cones, the additional step is to divide by 3.
 1.Identify the figure 2.Identify the shape of the base 3.Calculate the area of the base 4.Identify the height 5.Multiply the area of the base by the height 6.Label 7.For pyramids and cones, the additional step is to divide by 3.")
14
2d & 3d figures & Measurement Pattern blocks 5. Draw a rhombus. Now use a triangle and ascertain how many triangles it takes to equal one rhombus? One rhombus =_ triangles Now shade one of the triangles. What fractional part of the rhombus is shaded? 6. Draw a trapezoid. Now use a triangle and ascertain how many triangles it takes to equal one trapezoid. One trapezoid = triangles

15
Transformations Treasure Hunt Coordinate Plane Assignment

16
Mission: Treasure Hunt You are part of a special group known as "The Smarty Pants.“ You have been dropped off at GMS to locate and recover the "Key to Success." There are evil forces out there trying to make you fail this mission, so you are constantly moving around. There are also other groups (by the same name) trying to find the same treasure. Your goal is to be the first group to recover the treasure. Good Luck! Plot and label the points as you move. If you do it correctly, you should end at the treasure. Every member of the group must have the graph completed with labels. If they fail to have this, they will be eliminated!
 trying to find the same treasure. Your goal is to be the first group to recover the treasure. Good Luck. Plot and label the points as you move. If you do it correctly, you should end at the treasure. Every member of the group must have the graph completed with labels. If they fail to have this, they will be eliminated!.")
17
Treasure Hunt

18
Coordinate Plane

19
Angle Legs

20
Pythagorean Theorem Prior Teaching –Characteristics of right triangle –Legs and Hypotenuse –a, b, c

21
Pythagorean Theorem 3 4 On your graph paper, draw a 3 by 4 triangle. Use the ruler to draw the diagonal.

22
Pythagorean Theorem Shade in the squares, representing the area of each side.

23
Pythagorean Theorem Create a new square by combining the two areas. Cut the square out.

24
Pythagorean Theorem Glue the square against the diagonal of the triangle. Count the units. Calculate the sides of the square.

25
Pythagorean Theorem 3 4 c Theorem: a 2 + b 2 = c 2 3 2 + 4 2 = c 2 9 + 16 = c 2 25 = c 2 5 = c 5

26
Pythagorean Theorem a=8; b=?; c=10 On your graph paper, shade in squares, representing the area of each side.

27
Pythagorean Theorem Cut the squares out. Lay the smaller square on top of the larger square. Calculate the number of squares that are not covered. 36 squares

28
Pythagorean Theorem Create a new square with an area of 36.

29
Pythagorean Theorem 6 8 On your graph paper, draw a 6 by 8 triangle. Use the ruler to draw the diagonal. Place the 3 different squares on the sides.

30
Pythagorean Theorem 8 10 b Theorem: a 2 + b 2 = c 2 8 2 + b 2 = 10 2 64 + b 2 = 100 -64 b 2 = 36 b = 6 6

31
Proportions Paper clips Technology activity (ratios) Proportion cards Proportional vs. non-proportional

32
Paper Clip Proportions

33
Technology activity

34
Proportion Cards

35
Proportion???? 1.Susan runs 2 laps to John’s 3 laps. How many laps will Susan run if John runs 12 laps? 2.Sue and Julie were running equally fast around a track. Sue started first. When she had run nine laps, Julie had run three laps. When Julie had completed fifteen laps, how many laps had Sue run? Create tables for each and determine if a proportion can be used to solve.

36
Proportion???? 1.Susan runs 2 laps to John’s 3 laps. How many laps will Susan run if John runs 12 laps? Susan246810 John3691215 Equivalent ratios…Can use a proportion.

37
Proportion???? 2. Sue and Julie were running equally fast around a track. Sue started first. When she had run nine laps, Julie had run three laps. When Julie had completed fifteen laps, how many laps had Sue run? Sue9101112131415 Julie3456789 Non-equivalent ratios…Cannot use a proportion.

38
Compare and Contrast Compare and contrast the two problems.

39
Scale Factor and Dilations Prior Teaching –Scale factor when it is in whole number form –Two types of dilations –Criteria of each dilation

40
Say NO to Oreos You have 2 double stuf Oreos, 2 regular Oreos, and 3 Oreo minis. Do NOT eat the Oreos. We are going to use the Oreos to find scale factor. Remember to say NO to Oreos! You could copy three pictures of Oreos and classify them as Regular, double stuf, and mini. You could have the kids measure the pictures. When I go over the results, we use the measurements I have. We discuss why the measurements might be different.

41
Say NO to Oreos Calculate the height in inches of 2 regular Oreos. Round to the nearest half inch. Calculate the height in inches of 2 Double Stuf Oreos. Round to the nearest half inch. What type of dilation occurred to create the Double Stuf Oreo from the regular Oreo. 1 inch 1.5 inches Enlargement

42
Say NO to Oreos Will the scale factor be greater than 1? Calculate the scale factor used to create the Double Stuf Oreo. Remember to say NO to Oreos. Yes

43
Say NO to Oreos Calculate the diameter in inches of 1 regular Oreo. Round to the nearest half in. Calculate the diameter in inches of 1 Oreo Mini. Round to the nearest half in. What type of dilation occurred to create the Oreo Mini from the regular Oreo. 2 in 1 in Reduction

44
Say NO to Oreos Will the scale factor be greater than 1? Calculate the scale factor used to create the Oreo Mini. Remember to say NO to Oreos. No

45
Percent Applications Percent Change Tax & Discount Commission

46
Write down your estimates for the erasers on your object estimation sheet. Percent Change

47
How Many Erasers? 162

48
Percent Change

49
Tax Change % to a decimal. For every dollar you spend on the item, you add the amount of the percent. 5% =.05 =.05 added to every $ $8.00 item $1 5¢5¢5¢5¢5¢5¢5¢5¢5¢5¢ 5¢5¢5¢5¢5¢5¢ Tax: $.40 Total:$8.00 +.40 = $8.40

50
Discount Change % to a decimal. For every dollar you spend on the item, you subtract the amount of the percent. 5% =.05 =.05 subtracted from every $ $8.00 item Discount: $.40 Sales Price: $8.00 -.40 = $7.60 $1 5¢5¢5¢5¢5¢5¢5¢5¢5¢5¢ 5¢5¢5¢5¢5¢5¢

51
You have $2.00 to spend in the math store. There is a sale! 20% off everything in the store. The tax rate is 8%. Complete the order form and give to the store clerk (your partner). The store clerk will “ring” you up. Verify that your total matches the clerk’s. Fill out the check. Bring the order form and check to Mrs. Cook to receive the item(s). Tax & Discount
. The store clerk will ring you up. Verify that your total matches the clerk’s. Fill out the check. Bring the order form and check to Mrs. Cook to receive the item(s). Tax & Discount.")
52
Calculate your daily quiz mean for the week. You can earn 2% commission for your grade. Calculate the commission amount. Verify the total with Mrs. Cook. Write the amount in your checkbook register. Commission

53
Use the store circular to answer the percent questions. Percent Applications

54
Conversions Equivalency Book Equivalency Ransom Note Swat It

55
Find an equivalent fraction with a denominator of 100. Write as a decimal Convert to Decimal and % Write as a %

56
Conversions Equivalency Book Equivalency Ransom Note Swat It

57
SWAT It! The room is divided into 2 groups. One person from each group will stand on both sides of the screen with a fly swatter (never been used)! I will call out an amount. SWAT the equivalency for that amount. You cannot swat the same amount. 2 pts for First 1 pt for Second -1 pt for wrong answer -1 pt for answer given by another teammate
. I will call out an amount. SWAT the equivalency for that amount. You cannot swat the same amount. 2 pts for First 1 pt for Second -1 pt for wrong answer -1 pt for answer given by another teammate.")
58
20% 12.5% 30%17% 10% 11%50%33% 25%14%

59
11% 12.5%.1130%33%.14.325%.20.50 20%50%.3317%.10.50.1714%.125 10%

60
.125.17.75.2.14.11.25.1.33.5

61
Representations of Data

Similar presentations