Download presentation
1
Introducing Fetal ECG waveform analysis for Intrapartum Care
S Arulkumaran Professor & Head – Obstetrics & Gynaecology St.George’s Hospital Medical School University of London

2
Fetal Hypoxaemia > Hypoxia > Asphyxia
How to prevent fetal hypoxia? Diagnose hypoxia Institute corrective measures Deliver Fetal Hypoxaemia > Hypoxia > Asphyxia

3
Fetal response to hypoxemia
more effective uptake of oxygen Reduced activity decrease in growth rate maintained energy balance Oxygen saturation Hypoxemia Hypoxia Asphyxia Days and weeks Hours Minutes Time

4
The fetal response to hypoxia
surge of stress hormones redistribution of blood flow anaerobic metabolism in the peripheral tissues maintained energy balance Oxygen saturation Hypoxemia Hypoxia Asphyxia Days and weeks Hours Minutes Time

5
Fetal response to asphyxia
Alarm reaction anaerobic metabolism in peripheral tissues brain and heart organ failure Oxygen saturation Hypoxemia Hypoxia Asphyxia Days and weeks Hours Minutes Time

6
To prevent hypoxia we have to identify the fetus likely to be affected
The fetus untroubled by the events of labour. Troubled but able to fully compensate and is in no immediate danger. Troubled and utilising key resources in an attempt to compensate or unable to fully compensate.

8
Hypoxia from reduced cord blood flow
Oxygen reduces and CO2 increases (respiratory acidosis develops) If cord flow is not improved then base excess used up and bicarbonate reduces (metabolic acidosis develops) Major fetal organ damage
 If cord flow is not improved then base excess used up and bicarbonate reduces (metabolic acidosis develops) Major fetal organ damage.")
9
Pathophysiology of hypoxia
Negative Anaerobic metabolism Glycogenolysis Lactate Change in membrane potential due to liberation of potassium ST segment elevation & high T waves Metabolic acidosis DETECT by FBS DETECT by fetal ECG

10
The first observation 1971

11
ECG waveform analysis Fetal Scalp Electrode
& Maternal skin reference electrode

12
The ECG complex

13
ST-wave forms aerobic myocardial metabolism Normal ST
positive energy balance – Isoelectric line – T wave Only Changes in these parameters will be detected – hence the need to start analysis before changes take place

14
Myocardial energy balance
Positive Available oxygen Arterial saturation / Haemoglobin Myocardial blood flow Negative Consumed oxygen (Myocardial work load) HR / BP / contractility / adrenaline surge
 HR / BP / contractility / adrenaline surge.")
15
ST-wave forms T-wave amplitude hypoxia adrenaline surge
anaerobic metabolism

16
Recording 30 accepted ECG complexes Average ECG T/QRS ratio
biphasic ST

17
Changes in the ST segment & T wave
ST rise – a fetus responding to hypoxia Biphasic ST – a fetus not fully capable of responding or has not had time to respond

18
ST-wave forms Biphasic ST
Caused by an inability of the myocardium to respond; Prematurity, Infections, Increase in overall demand (mat fever), Myocardial dystrophy, Chronic hypoxia, Initial phase of acute hypoxia. grade 1 grade 2 grade 3
, Myocardial dystrophy, Chronic hypoxia, Initial phase of acute hypoxia. grade 1. grade 2. grade 3.")
19
STAN 21

20
Presentation of ST

21
FHR vs STAN – A Swedish RCT
Clinical management – FHR+ST Group preterminal FHR immediate delivery (regardless of ST) normal FHR no intervention (regardless of ST)
 normal FHR no intervention (regardless of ST)")
22
CTG vs. CTG+ST – A Swedish RCT
Clinical management – FHR (CTG)+ST Group FHR interpretation supported by the ST-log
+ST Group. FHR interpretation supported by the ST-log.")
23
STAN® simplified clinical guidelines
These guidelines are applicable to a term pregnancy of 36 completed gestational weeks or more. They indicate situations in which intervention is required. This means delivery or alleviation of a cause of fetal distress such as over-stimulation or maternal hypotension. During the second stage of labour with active pushing, immediate delivery is recommended. If there is an abnormal CTG and a normal ST during the second stage of labour, you can wait 90 minutes before intervention. The event log requires 20 minutes before automatic ST analysis can begin. At start-up and when there is a decrease in signal quality with discontinuous T/QRS ratios, manual data analysis is required.

24
The outcome of two RCTs

25
The Fetal ECG Project The Derby Experience
Mr Onnig Tamizian - Clinical Research Fellow, Mr.Ian Symonds - Senior Lecturer, S.Arulkumaran - Professor

26
7.268+/-0.074 7.195+/-0.077

27
6.65 mmol/l +/-3.68 4.33 mmol/l +/-3.01

28
5.88 mmol/l +/-2.39 4.07 mmol/l +/-1.60

30
Cochrane collaboration
Neilson JP. Fetal eleectrocardiogram (ECG) for fetal monitoring during labour. The Cochrane library, Issue 2, Oxford
 for fetal monitoring during labour. The Cochrane library, Issue 2, Oxford.")
31
Neilson JP. Fetal eleectrocardiogram (ECG) for fetal monitoring during labour. The Cochrane library, Issue 2, Oxford The use of ST waveform analysis (7400 women) was associated with fewer babies with severe metabolic acidosis at birth (cord pH <7.05 and BD>12 mmol/L. RR 0.44, 95% CI This was achieved with fewer fetal scalp samples during labour (RR 0.86) and fewer operative deliveries (RR 0.89)
 was associated with fewer babies with severe metabolic acidosis at birth (cord pH <7.05 and BD>12 mmol/L. RR 0.44, 95% CI This was achieved with fewer fetal scalp samples during labour (RR 0.86) and fewer operative deliveries (RR 0.89)")
32
Neilson JP. Fetal eleectrocardiogram (ECG) for fetal monitoring during labour. The Cochrane library, Issue 2, Oxford These findings support the use of ST waveform analysis when a decision is made to undertake continuous EFM in labour. A better approach might be to restrict fetal ST waveform analysis to those fetuses demonstrating disquieting features on CTG (*opinion)
")
33
Ms L C 30 years old Primip PMSH - Nil Current Pregnancy - uneventful Admitted T+12 for IOL Prostin 2mg x 2 on

34
2200 hrs CTG after Prostin

35
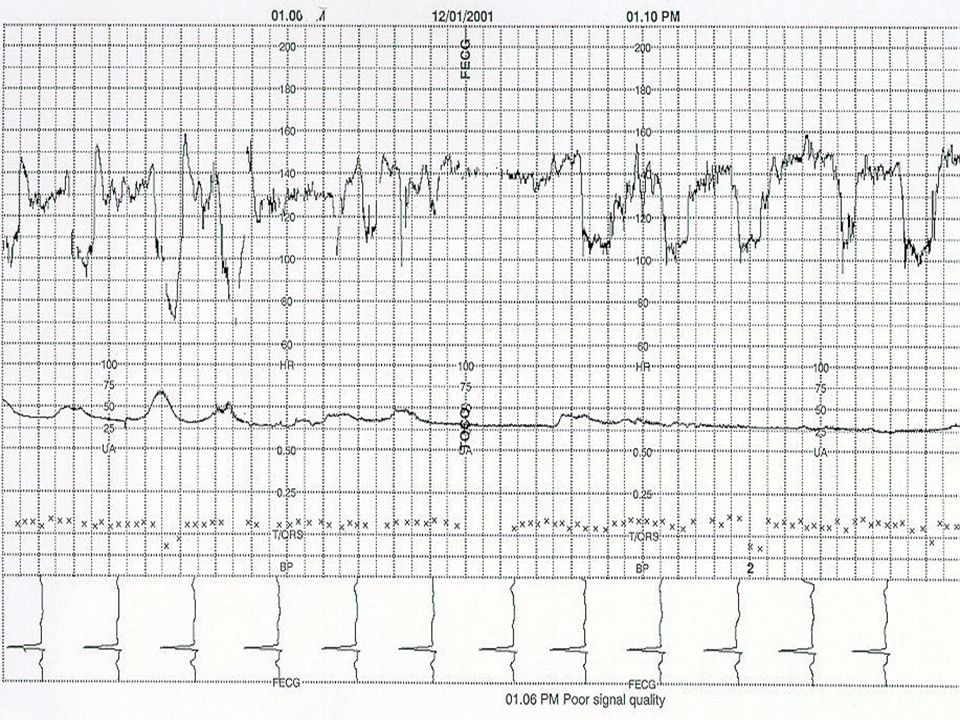
06.00 hrs

36
0600 hours - CTG after SROM - Meconium stained liquor
0630 hours -In view of meconium Augment with Oxytocin ??

37
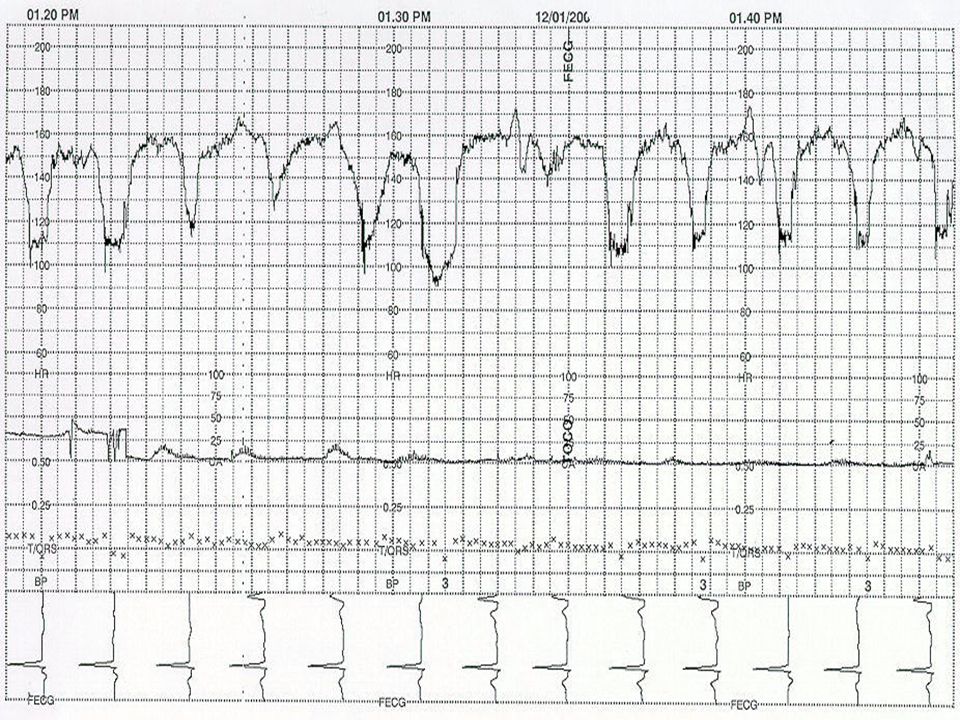
9.00 hrs - persistent decelerations for FBS in view of meconium

38
1015 hours FBS pH BE -4.2 Cx - 3cm dilated?

44
1450 hours Cx fully dilated ROT at spines

45
1520 hours - NVD Apgar 9 at 1’ & 10 at 5’ Art - pH 7.059, BE 8.17 Ven -pH 7.143, BE 8.71

46
THANK YOU


 e.g Timboon District Healthcare Service 15 minutes to present STATS.>")
: Part 1 - Introduction>")


