Download presentation
Presentation is loading. Please wait.

1
Section 5 Professor Donald McFarlane
Biology 44 Section 5 Professor Donald McFarlane Lecture Ecology: Population Growth

2
Population – group of interbreeding individuals occupying the same habitat at the same time
Water lilies in a particular lake Humans in New York City Population ecology – study of what factors affect population size and how these factors change over space and time

3
How populations grow Life tables can provide accurate information about how populations grow from generation to generation Simpler models can give insight to shorter time periods Exponential growth – resources not limiting, prodigious growth Logistic growth – resources limiting, limits to growth

4
Per capita growth rate Change in population size over any time period
Often births and deaths expressed per individual 100 births to 1000 deer = 0.10 50 deaths in 1000 deer = 0.05 Net Reproductive Rate, R0, is approximately birth rate – death rate R0 ~ (b – d) ~ (0.1 – 0.05) = 0.05
 ~ (0.1 – 0.05) =")
5
dt r = “intrinsic rate of increase” = -ln R0 Tgen
The differential growth equation: dN = rN dt

6
R0 for deer was 0.05 Tgen is 4 years Therefore r = - ln(0.05)/4 = 0.748 dN = rN dt Starting with 10 deer (N0 = 10) N0 = 10 N1 = 17 N2 = 31 ` N3 = 53 N4 = 94 N5 = 163

7
Exponential growth When r>0, population increase is rapid
Characteristic J-shaped curve Occurs when population growth is UNREGULATED by the environment e.g., growth of introduced exotic species, yeast in brewing medium, and global human population

9
(b) Black-footed ferrets
Copyright © The McGraw-Hill Companies, Inc. Permission required for reproduction or display. 600 400 Predicted abundance Actual abundance 500 400 200 Number of animals Population size 300 200 100 100 2000 2001 2003 2004 2005 2006 1970 1980 1990 2000 Year Survey year (a) Tule elk (b) Black-footed ferrets
 Tule elk. (b) Black-footed ferrets.")
10
Logistic growth Eventually, resources become limiting as populations grow Carrying capacity (K) or upper boundary for population Logistic equation dN = rN ( K – N ) dt K
 dt K.")
13
Not all individuals in a population are the same with respect to births and deaths…..
We can account for differences with a LIFE TABLE

14
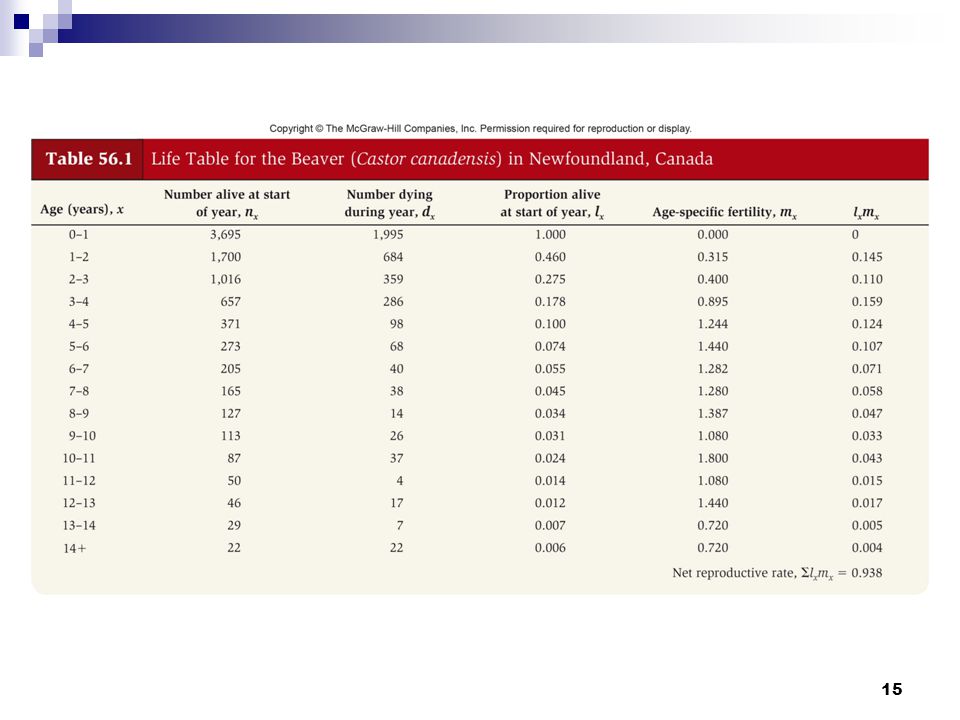
Age-specific fertility rate, mx
Proportion of female offspring born to females of reproductive age 100 females produce 75 female offspring mx=0.75 Age-specific survivorship rate, lx Use survivorship data to find proportion of individuals alive at the start of any given age class lxmx = contribution of each age class to overall population growth

16
Density-dependent factors
Mortality factor whose influence varies with the density of the population Parasitism, predation, and competition Predators kill few prey when the prey population is low, they kill more prey when the population is higher Detected by plotting mortality against population density and finding positive slope Density-independent factor Mortality factor whose influence is not affected by changes in population size or density Generally physical factors – weather, drought, flood, fire

18
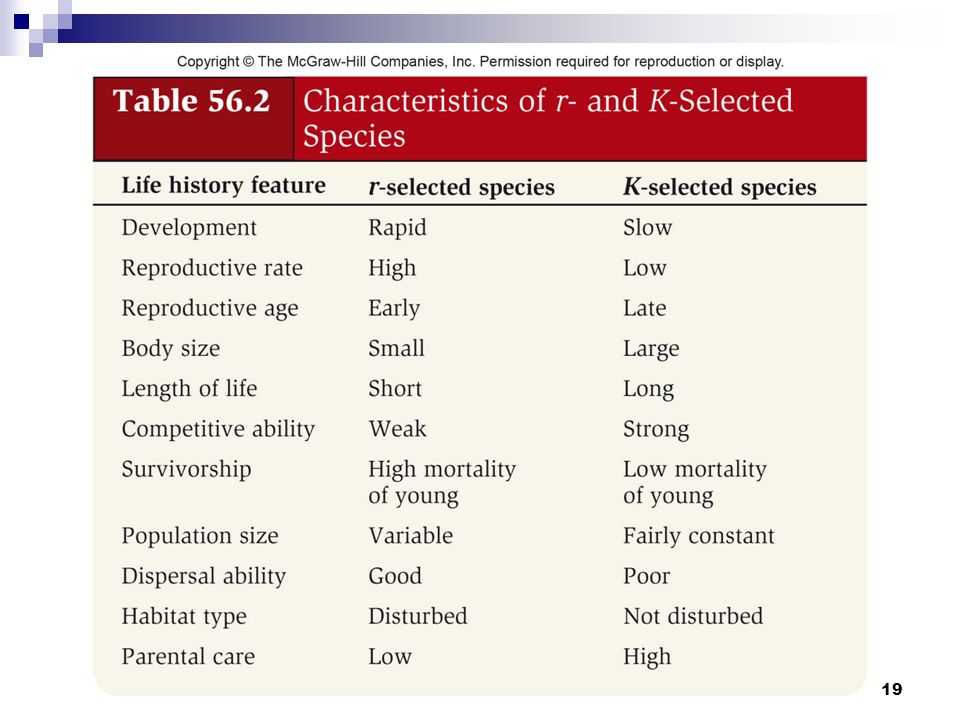
Life history strategies
Continuum r-selected species – high rate of per capita population growth, r, high mortality rates K-selected species – more or less stable populations adapted to exist at or near carrying capacity, K Lower reproductive rate but lower mortality rates

20
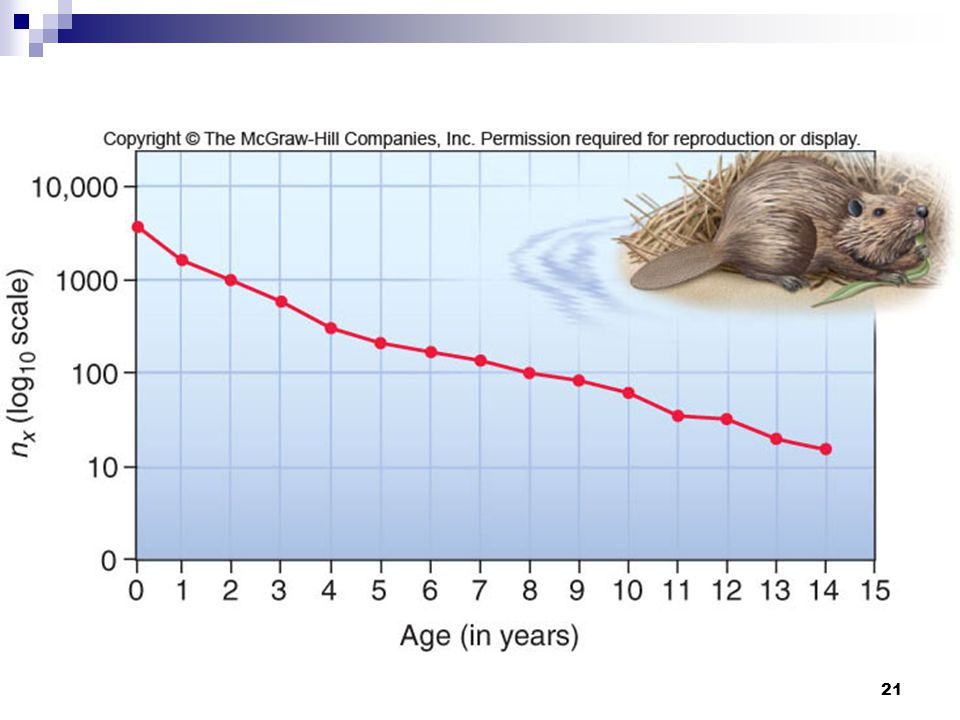
Survivorship curve – plots numbers of surviving individuals at each age
Use log scale to make it easier to examine wide range of population sizes Beavers have a fairly uniform rate of death over the life span

22
3 patterns of survivorship curves
Type I – rate of loss of juveniles low and most individuals lost later in life Type II – fairly uniform death rate Beaver example Type III – rate of loss for juveniles high and then loss low for survivors

24
Population (billions)
Copyright © The McGraw-Hill Companies, Inc. Permission required for reproduction or display. 8 7 6 2000 5 Population (billions) 4 1975 3 1950 2 1900 1 1800 1 C.E 1000 C.E 2000 C.E 7000 B.C.E 6000 B.C.E 5000 B.C.E 4000 B.C.E 3000 B.C.E 2000 B.C.E 1000 B.C.E
 C.E C.E C.E B.C.E B.C.E B.C.E B.C.E B.C.E B.C.E B.C.E.")
Similar presentations


 How many are in the population? 2) Are its numbers increasing.>")


 Sketch an exponential population growth curve and a logistic population growth curve. 2.What is an ecological footprint? 3.What.>")


