Download presentation
Presentation is loading. Please wait.

1
Updates on NOAA MM5 Assessment Where we left off Buoy assessment Temperature problems Solar radiation assessment Z T simulation Analysis nudging Where next?

2
1 2 3 4 5 6 7 8 9

4
Regional speed biases 20.360.22 3-0.01-0.02 40.310.14 50.300.09 6-0.01-0.06 7-0.020.05 80.120.01 9-0.14-0.16 Average0.11 m/s0.03 m/s AREAE mb (m/s)EF mb (m/s)
EF mb (m/s)")
8
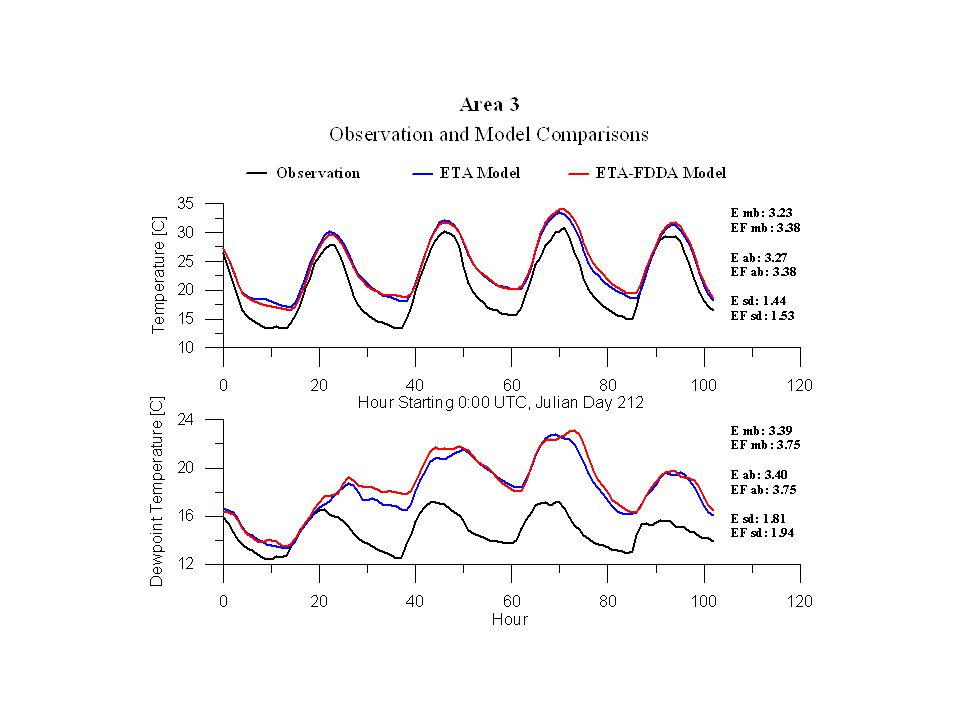
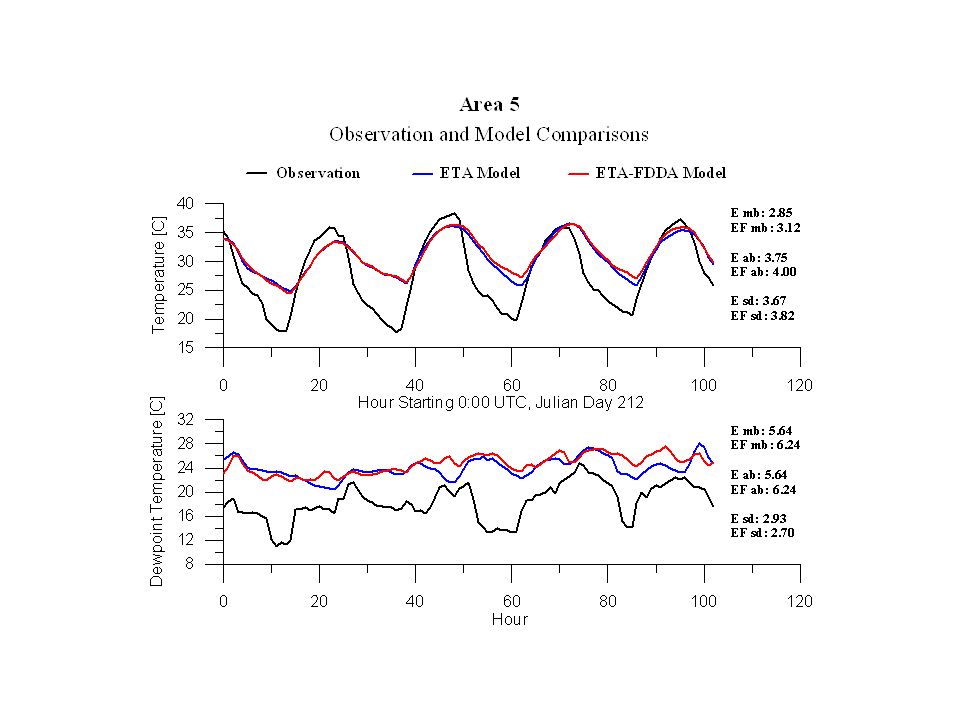
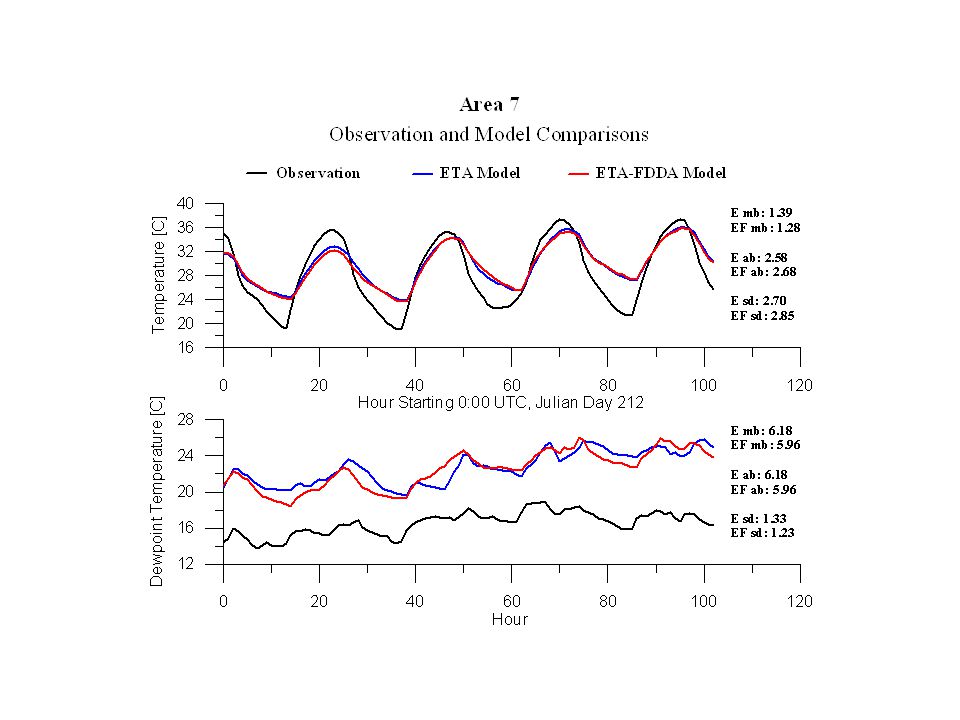
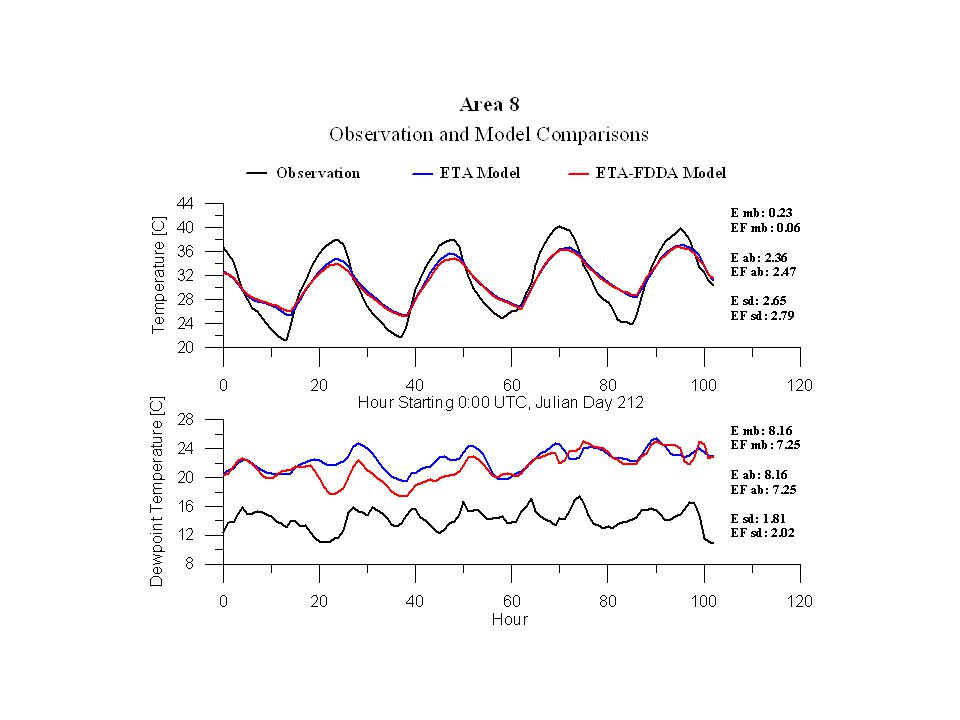
Regional Surface T &Td biases AREAT mb (C)Td mb (C) NB3.8 SB4.5 24.33.4 33.24.0 47.15.6 52.95.2 61.55.6 71.46.2 80.28.2 9-1.33.2
Td mb (C) NB3.8 SB")
9
North Buoy South Buoy

15
Regional Surface T &Td biases AREAT mb (C)Td mb (C) NB3.8 SB4.5 24.33.4 33.24.0 47.15.6 52.95.2 61.55.6 71.46.2 80.28.2 9-1.33.2
Td mb (C) NB3.8 SB")
16
Daytime T biases AREAT mb (C) NB4 SB5 2-2 32 44 5-1.5 6 7-2 8-3 9-3.5
 NB4 SB")
17
Surface T & Td Summary Offshore and in Bay Area model has warm bias As air parcels move inland, warm T bias decreases and eventually disappears, Td moist bias increases As air parcels move inland, cold daytime bias increases CV has too small of an diurnal cycle in T CV has too moist Td’s Decreasing soil moisture will decrease cold daytime bias, increase diurnal range, and reduce Td bias

18
BGB JD 213 RASS Model Difference

19
RMD JD 213

20
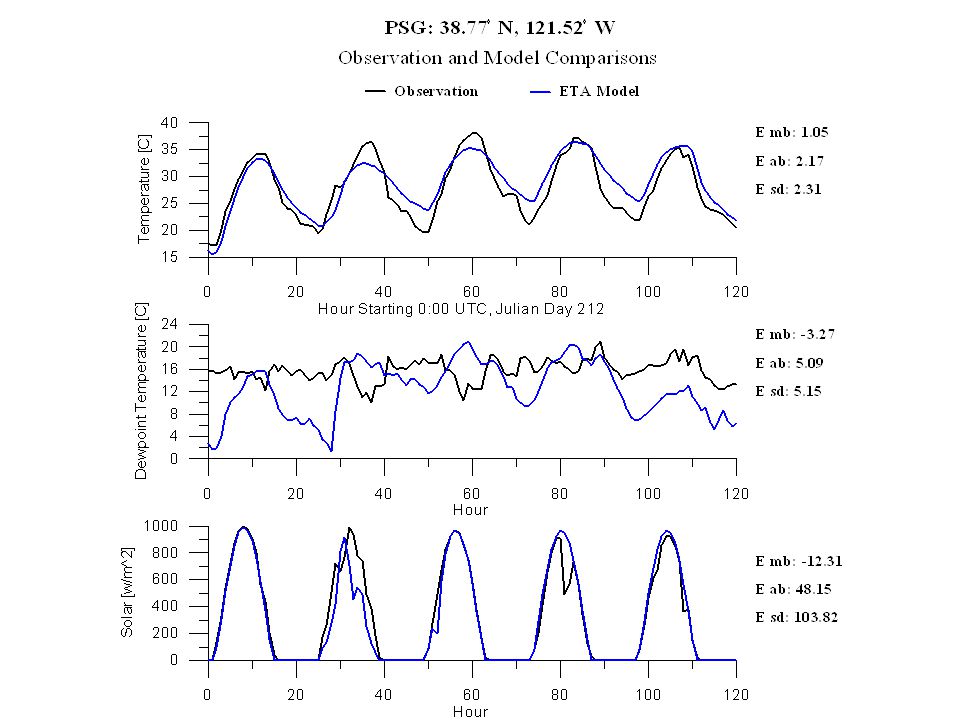
PSG JD 213

21
RDG JD 213

23
BKF JD 213

24
RASS Summary Model has cold bias of 2-3 C (esp daytime) too at least 600m AGL Model has too small of diurnal cycle Decreasing soil moisture will help both
 too at least 600m AGL Model has too small of diurnal cycle Decreasing soil moisture will help both")
25
Solar Radiation Analysis Could temperature errors be caused by clouds amount error in model?

32
Solar Radiation Summary MM5 does a pretty good job of getting solar radiation correct. If anything, tends to over-predict solar radiation. To double check, ran simulation with cloud absorption turned off – little difference.

33
Z 0T Simulation MM5 default has Z 0T = Z 0M, but it should have Z 0T < Z 0M Z 0T = Z 0M exp[-kC (R e* ) 1/2 ] where R e* = Z 0M u * /μ
![Z 0T Simulation MM5 default has Z 0T = Z 0M, but it should have Z 0T < Z 0M Z 0T = Z 0M exp[-kC (R e* ) 1/2 ] where R e* = Z 0M u * /μ](http://images.slideplayer.com/13/4065878/slides/slide_33.jpg "Z 0T Simulation MM5 default has Z 0T = Z 0M, but it should have Z 0T < Z 0M Z 0T = Z 0M exp[-kC (R e* ) 1/2 ] where R e* = Z 0M u * /μ")
36
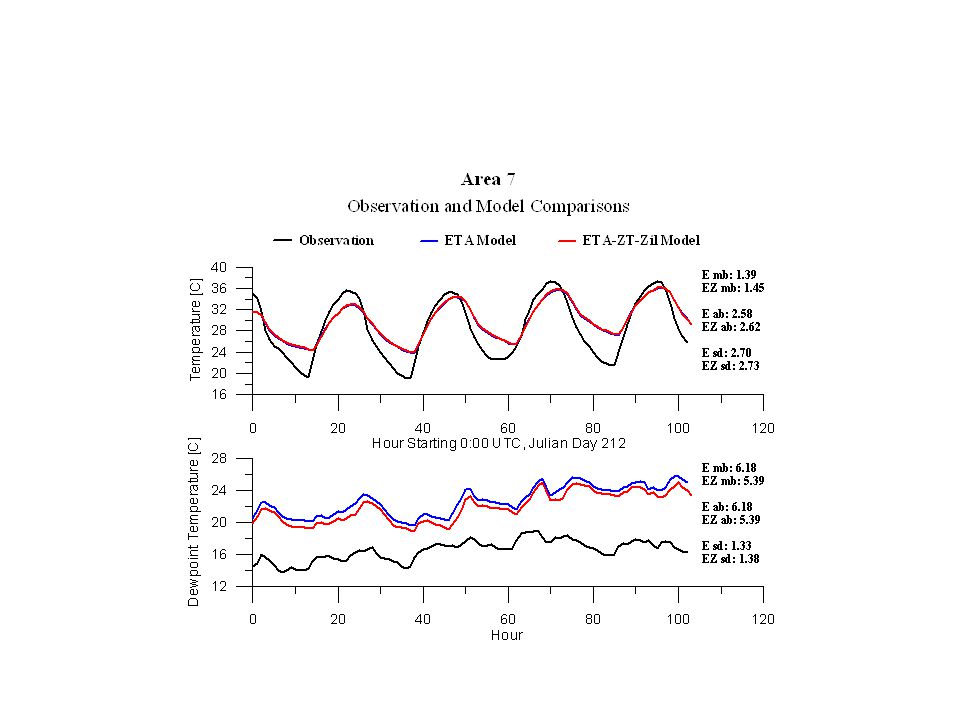
Effect of Zilintinkevitch formulation only changes Td (for the better, reducing bias by ~15%)
")
37
Analysis Nudging Uses NCEP 40km gridded analysis Nudged only on 36km resolution outer MM5 grid No nudging within model diagnosed PBL

45
Summary Off-shore winds look reasonable, no significant speed bias. Directions good except last 1-2 days, with model winds too northerly. Surface T & Td and RASS assessments show: –Off-shore temps too warm due to lack of strong marine layer in the model. –In-valley surface T and Td biases become progressively cool and moist the further inland parcels go –model has cool bias to at least 700m AGL, and too small an amplitude to diurnal cycle Solar radiation is not source of in-valley temperature errors. New Z T formulation only improves Td, not T. Most likely that in-valley temperature errors are caused by land-surface model and/or too much soil moisture Analysis nudging run likely gives best winds so far. Will it give better ozone predictions?

46
Simulation Status Two additional analysis nudging simulations completed, not yet analysed –36 km grid, all levels except surface –36 km grid, all levels including surface Simulations planned –Reduced soil moisture (will it cause too much inflow through Bay Area?) –Alternate Z T formulations –Analysis nudging on 12 km grid –Combined analysis/obs nudging (with vertical spreading of obs)
 –Alternate Z T formulations –Analysis nudging on 12 km grid –Combined analysis/obs nudging (with vertical spreading of obs)")
Similar presentations


 See Alcott and Steenburgh 2013 for further details on most aspects of this numerical configuration:>")


