Download presentation
Presentation is loading. Please wait.

1
Instrument QC and Qualification

2
Overview Why QC is Important LSRII Optical Configuration LSRII QC
Validation Optimization Calibration Standardization Practice Analysis

3
Characterizing the Cytometer

4
Challenges… Instrument - optical configuration, optimization, standardization, and calibration Reagent - optimization and standardization Sample processing Staining protocols Data Analysis - compensation & gating Operators Volume of data (death-by-excel!) More on instruments - configuration = laser (power and wavelength… ex percp is great w/ low power but crap with higher power, and PE tandems are better excited using green, rather than blue (yet another mario/perfetto pub). Optimization is hitting voltage sweet-spots for maximum signal:noise and minimal interference (another perfetto pub). Calibration is target channels (where positive stays in same place across assays, instruments, labs, etc) Note on reagents - tandems are very delicate; when handled properly very nice, but exposure to light/certain fixatives/ambient temperature may result in false positives, generated by degradation of the dye (ex CD8 APC-Cy7 and IFNg APC, if APC-Cy7 tandem degrades, then a small amount of CD8 APC signal will appear as IFNg APC). So, vigilance in following protocols is key. Changed preparation to processing (as in PBMC processing), so as to distinguish from staining protocols I don’t understand “waiting time” but left it as is Gating is the largest source of variation, AFTER the areas listed above have been addressed…holden et al BMC Immunology manuscript example for ICS would win browny points for Holden fans in the audience ;) Duke University Medical Center
 More on instruments - configuration = laser (power and wavelength… ex percp is great w/ low power but crap with higher power, and PE tandems are better excited using green, rather than blue (yet another mario/perfetto pub). Optimization is hitting voltage sweet-spots for maximum signal:noise and minimal interference (another perfetto pub). Calibration is target channels (where positive stays in same place across assays, instruments, labs, etc) Note on reagents - tandems are very delicate; when handled properly very nice, but exposure to light/certain fixatives/ambient temperature may result in false positives, generated by degradation of the dye (ex CD8 APC-Cy7 and IFNg APC, if APC-Cy7 tandem degrades, then a small amount of CD8 APC signal will appear as IFNg APC). So, vigilance in following protocols is key. Changed preparation to processing (as in PBMC processing), so as to distinguish from staining protocols. I don’t understand waiting time but left it as is. Gating is the largest source of variation, AFTER the areas listed above have been addressed…holden et al BMC Immunology manuscript example for ICS would win browny points for Holden fans in the audience ;) Duke University Medical Center.")
5
Two Methods of Instrument Charaterization
BD CS&T: Cytometer Setup and Tracking

6
Instrument Performance
Parameters CS&T Perfetto Laser (amps vs mW) yes yes CV (resolution) yes (target) yes (range) Signal-to-noise ratio NO yes (range) Linearity Yes (range) yes (range) Specific fluorescence NO yes (target) Automated YES NO
 yes yes. CV (resolution) yes (target) yes (range) Signal-to-noise ratio NO yes (range) Linearity Yes (range) yes (range) Specific fluorescence NO yes (target) Automated YES NO.")
7
Each Experiment & Troubleshooting
Instrument QC Frequency Purpose Initial Characterization & After Optical Service Validation: optimal voltage range for each detector Once Per Assay Optimization: assay specific optimal voltage for each detector & assay specific target channels Each Experiment & Troubleshooting Calibration: set detectors to assay specific target channel values for specimen acquisition Standardization: Monitor trendlines using assay specific target channels over time

8
Key Performance Factors in High-Quality Flow Cytometry Data
Resolution of subpopulations, including dim subpopulations Sensitivity Relative measured values of fluorescence Linearity and accuracy Reproducibility of results and cytometer performance Tracking Comparison of results across time and amongst laboratories Standardization

9
LSRII qualification Validation Linearity Resolution (CV)
Signal-to-Noise Ratio (S:N) - LLOD & LLOQ Optimization Select Optimal Voltages for Inst Performance with Assay-Specific Reagents - reduce spillover (Specificity) Establish Assay-Specific Target Channels Calibration (“Daily QC”) Set Daily Voltages Verify Voltages are within acceptable Range (P/F) Verify CVs are within acceptable Range (P/F) Set Target Channels for Specimen Acquisition (P/F) Standardization - Reproducibility/Precision Record Daily Target Channel Values Record Daily Voltages Record Daily CVs Calculate Daily S:N Plot & Review Monthly Trendlines
 - LLOD & LLOQ. Optimization. Select Optimal Voltages for Inst Performance with Assay-Specific Reagents - reduce spillover (Specificity) Establish Assay-Specific Target Channels. Calibration ( Daily QC ) Set Daily Voltages. Verify Voltages are within acceptable Range (P/F) Verify CVs are within acceptable Range (P/F) Set Target Channels for Specimen Acquisition (P/F) Standardization - Reproducibility/Precision. Record Daily Target Channel Values. Record Daily Voltages. Record Daily CVs. Calculate Daily S:N. Plot & Review Monthly Trendlines.")
10
Linearity Definition: Proportionality of output to input
Method: Access linearity using the ratio of two pulses over voltage range of the PMT Significance: Linearity is important for compensation (Median Pk6 - Median Pk5) Median Pk5 = Constant
 Median Pk5. = Constant.")
11
Linearity Important for fluorescence compensation
Defined as proportionality of output (MFI) to input (Fluorescence/ # of photons) Important for fluorescence compensation Compensation of data in the last decade involves subtraction of large numbers Small errors (non-linearity) in one or both large numbers can cause a large absolute error in the result Ab = X Ab = 2X X Abs 2X Abs = 1000 MFI 2000 MFI 1000 2000 3000
 to input (Fluorescence/ # of photons) Important for fluorescence compensation. Compensation of data in the last decade involves subtraction of large numbers. Small errors (non-linearity) in one or both large numbers can cause a large absolute error in the result. Ab = X. Ab = 2X. X Abs. 2X Abs. = 1000 MFI MFI")
13
Linearity: Effect on Compensation
Compensation of data in the last decade involves subtraction of large numbers Errors (non-linearity) in one or both large numbers can cause a large absolute error in the result FITC PE A 68 80 Detector Median Fluorescence Intensity (MFI) 5921 79 C 1796 75 B 73,000 365 D BD CompBeads stained with varying levels of FITC-Ab. Compensation was set using samples A and C. This cytometer had a 2% deviation from linearity above 50,000 units.
 in one or both large numbers can cause a large absolute error in the result. FITC. PE. A Detector. Median Fluorescence Intensity (MFI) C B. 73, D. BD CompBeads stained with varying levels of FITC-Ab. Compensation was set using samples A and C. This cytometer had a 2% deviation from linearity above 50,000 units.")
14
LSRII Qualification Validation Optimization Calibration (“Daily QC”)
Linearity Resolution (CV) Signal-to-Noise Ratio (S:N) - LLOD & LLOQ Optimization Select Optimal Voltages for Inst Performance with Assay-Specific Reagents - reduce spillover (Specificity) Establish Assay-Specific Target Channels Calibration (“Daily QC”) Set Daily Voltages Verify Voltages are within acceptable Range (P/F) Verify CVs are within acceptable Range (P/F) Set Target Channels for Specimen Acquisition (P/F) Standardization - Reproducibility/Precision Record Daily Target Channel Values Record Daily Voltages Record Daily CVs Calculate Daily S:N Plot & Review Monthly Trend lines
 Signal-to-Noise Ratio (S:N) - LLOD & LLOQ. Optimization. Select Optimal Voltages for Inst Performance with Assay-Specific Reagents - reduce spillover (Specificity) Establish Assay-Specific Target Channels. Calibration ( Daily QC ) Set Daily Voltages. Verify Voltages are within acceptable Range (P/F) Verify CVs are within acceptable Range (P/F) Set Target Channels for Specimen Acquisition (P/F) Standardization - Reproducibility/Precision. Record Daily Target Channel Values. Record Daily Voltages. Record Daily CVs. Calculate Daily S:N. Plot & Review Monthly Trend lines.")
15
cvs

16
Instrument Sensitivity: Two Definitions
Defining sensitivity Threshold: Degree to which a flow cytometer can distinguish particles dimly stained from a particle-free background. Usually used to distinguish populations on the basis of Molecules of Soluble Equivalent Fluorochrome (MESF). Resolution: Degree to which a flow cytometer can distinguish unstained from dimly stained populations in a mixture. How to measure instrument-dependent sensitivity? Resolution sensitivity is a function of three independent instrument factors: Br Qr Electronic noise (SDen) Although low MESF values indicate “good” instrumental (threshold) sensitivity, this by no means guarantees an instrument will be able to resolve dim over background.
. Resolution: Degree to which a flow cytometer can distinguish unstained from dimly stained populations in a mixture. How to measure instrument-dependent sensitivity Resolution sensitivity is a function of three independent instrument factors: Br. Qr. Electronic noise (SDen) Although low MESF values indicate good instrumental (threshold) sensitivity, this by no means guarantees an instrument will be able to resolve dim over background.")
17
Background contributions

18
Why is Br important? High Br widens negative and dim populations.
High Br value = lower resolution Low Br value = higher resolution Low Br High Br

19
Br: Optical Background from Propidium Iodide
Example: It is common to use propidium iodide (PI) to distinguish live from dead cells. Propidium iodide was added in increasing amounts to the buffer containing beads, and Qr and Br were estimated. PerCP 1000 2000 3000 4000 5000 6000 7000 8000 9000 1 2 3 4 5 6 PI-free dye (µg) Br 0.01 0.02 0.03 0.04 0.05 Qr Residual PI in your sample tube will increase Br, which will reduce sensitivity.
 to distinguish live from dead cells. Propidium iodide was added in increasing amounts to the buffer containing beads, and Qr and Br were estimated. PerCP PI-free dye (µg) Br Qr. Residual PI in your sample tube will increase Br, which will reduce sensitivity.")
21
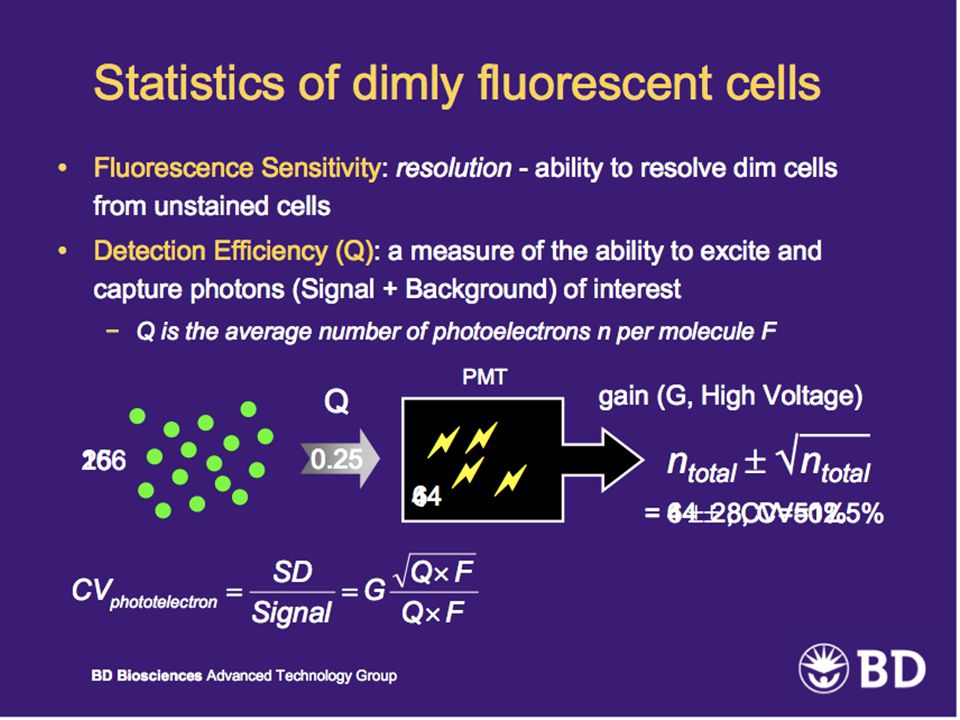
Relative Q: Qr # photoelectrons Qr # fluorescence molecules
Qr is photoelectrons per fluorescence unit and indicates how bright a reagent will appear on the sample when measured in a specific detector. # photoelectrons Qr = # fluorescence molecules PMT 1 2 photoelectrons Qr = = 0.25 8 fluorescence molecules In the example below, a cell with a the same number of fluorescence molecules can be detected differently by two different systems. A system with a high Qr would detect a larger number of photons for the same population than a system with a lower Qr. If a system has a lower relative Q, it produces fewer photoelectrons per fluorescence molecule, which would contribute to a higher CV and lower resolution sensitivity. The CS&T application calculates Qr for all fluorescence parameters based on the median and the rCV values for each of the CS&T fluorescent beads. PMT 2 1 photoelectron Qr = = 0.125 8 fluorescence molecules

22
Low Qr value = lower resolution High Qr value = higher resolution
Why is Qr important? A system with a higher Qr has a better resolution than a system with a lower Qr. Low Qr value = lower resolution High Qr value = higher resolution High Qr Low Qr

23
What Factors Affect Qr? Laser power Optical efficiency
PMT sensitivity (red spectrum) Poor PMT performance Dirty flow cell Dirty or degraded filter Qr is affected by the laser power, which in turn is affected by laser alignment. Diminished laser power can also indicate a dying laser. It is also affected by the overall optical efficiency and PMT spectral sensitivity. The PMTs are less sensitive in the red spectrum. A lower Qr reading is usually observed in the red parameters. Optical design also has an impact on the relative Q. A low reading can result from any of the following: dirty flow cell dirty or degraded filter poor PMT performance
 Poor PMT performance. Dirty flow cell. Dirty or degraded filter. Qr is affected by the laser power, which in turn is affected by laser alignment. Diminished laser power can also indicate a dying laser. It is also affected by the overall optical efficiency and PMT spectral sensitivity. The PMTs are less sensitive in the red spectrum. A lower Qr reading is usually observed in the red parameters. Optical design also has an impact on the relative Q. A low reading can result from any of the following: dirty flow cell. dirty or degraded filter. poor PMT performance.")
24
Spillover Decreases Resolution Sensitivity
Spread from APC Cy-7 background Population resolution for a given fluorescence parameter is decreased by increased spread due to spillover from other fluorochromes.

25
Summary: Instrument Performance and Sensitivity
Qr and Br are independent variables, but both affect sensitivity. Increases in Br or decreases in Qr can reduce sensitivity and the ability to resolve dim populations. On digital instruments, BD FACSDiva™ software v6 and CS&T provides the capability to track performance data for all of these metrics, also allowing users to compare performance between instruments. Br Qr y Sensitivit relative Instrument performance can have a significant impact on the performance of an assay.

26
Resolution vs. Background
Negative Population Positive Negative population has low background Populations well resolved Negative population has high background Populations not resolved Negative population has low background high CV (spread) Populations not resolved The ability to resolve populations is a function of both background and spread of the negative population.
 Populations not resolved. The ability to resolve populations is a function of both background and spread of the negative population.")
27
Measuring Sensitivity: The Stain Index
The Stain Index is a measure of reagent performance on a specific cytometer, a normalized signal over background metric. Brightness Width of negative The brightness is a function of the assay (antigen density, fluorochrome used). The width of the negative is a function of: Instrument performance (Qr, Br, and SDen) [single-color] The assay (Fluorescence spillover / compensation) [multicolor] The cell population
. The width of the negative is a function of: Instrument performance (Qr, Br, and SDen) [single-color] The assay. (Fluorescence spillover / compensation) [multicolor] The cell population.")
28
Stain Index: Normalized Signal/Background
D/W = Relative Brightness (SI) Index Stain = Goal: Normalize the signal to the spread of background where background may be autofluorescence, unstained cells, or compensated cells from another dye dimension. D Wunstained Wcompensated dye Stain Index… a better way to determine relative brightness for individual fluors. D = difference between positive and negative peak medians W = the spread of the background peak (= 2X rSDnegative) 1Stain Index: metric used by Dave Parks, Stanford – Presented at ISAC 2004
 Index. Stain. = Goal: Normalize the signal. to the spread of background. where background may be. autofluorescence, unstained. cells, or compensated cells. from another dye dimension. D. Wunstained. Wcompensated dye. Stain Index… a better way to determine relative brightness for individual fluors. D = difference between positive and negative peak medians. W = the spread of the background peak (= 2X rSDnegative) 1Stain Index: metric used by Dave Parks, Stanford – Presented at ISAC")
29
Electronic Noise (SDEN): Determining Baseline PMT Voltages
The BD FACSDiva™ 6.0 CS&T module analyzes dim particles, which are similar to dim cells’ brightness, allowing relevant detector baselines to be visualized by plotting fluorescence intensity vs (PMT gain, CV, and SD) PE: Detailed Performance Plot Dim Bead For this detector, the SDEN = 18 Fluorescence intensity of dim bead = 10 x SDEN = 180 CV Standard Deviation PMT Voltage 10000 1000 Determine PMT voltage required to set the dim beads at = 500 volts = baseline voltage 500 V 1000 CV or SD PMT Voltage As PMT voltage is lowered, CV increases resolution decreases 100 18 As PMT voltage is increased CV unchanged resolution unchanged 10 100 180 1 10 100 1000 10000 100000 Median Fluorescence Intensity
 PE: Detailed Performance Plot. Dim Bead. For this detector, the SDEN = 18. Fluorescence intensity of dim bead = 10 x SDEN = 180. CV. Standard Deviation. PMT Voltage Determine PMT voltage required to set the dim beads at 180 = 500 volts = baseline voltage. 500 V CV or SD. PMT Voltage. As PMT voltage is lowered, CV increases resolution decreases As PMT voltage is increased CV unchanged resolution unchanged Median Fluorescence Intensity.")
30
PMT Voltages: Optimal Gains Can Reduce Classification Errors
CD4 dim monocytes CD4+ lymphocytes CD4 negative % Negative in CD4+ Monocyte Gate 0.0% 2.0% 4.0% 6.0% 8.0% 10.0% 12.0% -100 100 PMT Voltage Offset % Negative in CD4 Gate 650 V 750 V

32
Methods Used for Validation
Which Beads to Use What Values to Plot Selection Criteria

33
Example LSRII Optical Configuration
Blue Laser (488nm) Duke LSRII SSC Blue FITC 515/20 505LP 575/25 550LP PE ミ 488LP Red Laser (635nm) Duke LSRII APC Alexa 680 710/50 685LP 780/60 740LP Cy7 660/20 Green Laser (532nm) Duke LSRII PE Cy7 Cy5 TR Cy5.5 PE- Green 780/40 610/20 710/50 660/40 575/25 740LP 640LP 600LP 690LP Violet Laser (407nm) Duke LSR II QDot 705 605 545 585 655 565 705/70 585/42 660/40 605/40 560/40 670LP 595LP 570LP 630LP 557LP 535LP Am Cyan 515/20 505LP Cas Blue 450/50 Change to config from Jennifer Duke University Medical Center
 Duke LSRII. SSC. Blue. FITC. 515/ LP. 575/ LP. PE. ミ. 488LP. Red Laser. (635nm) Duke LSRII. APC. Alexa / LP. 780/ LP. Cy7. 660/20. Green Laser. (532nm) Duke LSRII. PE. Cy7. Cy5. TR. Cy5.5. PE- Green. 780/ / / / / LP. 640LP. 600LP. 690LP. Violet Laser. (407nm) Duke LSR II. QDot / / / / / LP. 595LP. 570LP. 630LP. 557LP. 535LP. Am. Cyan. 515/ LP. Cas. Blue. 450/50. Change to config from Jennifer. Duke University Medical Center.")
34
Beads Used for LSRII Validation
8 Peak Rainbow: v in 50v increments (all PMTs) Non-fluorescent to Very Bright; Broad Spectrum Ex & Em 8pks Run: Once, then after optical service - “High” flow rate & LOG scale Uses: Validation Check Linearity: (MedianPk6-MedianPk5)/MedianPk5 Check CV: CV Pk5 Check S:N (LLOD & LLOQ): MedianPk5/MedianBlank Unstained Comp Beads: v in 50v increments (all PMTs) Non-fluorescent 1pk Run: Once, then after optical service- “High” flow rate & LOG scale
 Non-fluorescent to Very Bright; Broad Spectrum Ex & Em. 8pks. Run: Once, then after optical service - High flow rate & LOG scale. Uses: Validation. Check Linearity: (MedianPk6-MedianPk5)/MedianPk5. Check CV: CV Pk5. Check S:N (LLOD & LLOQ): MedianPk5/MedianBlank. Unstained Comp Beads: v in 50v increments (all PMTs) Non-fluorescent. 1pk. Run: Once, then after optical service- High flow rate & LOG scale.")
35
Example of Optimal PMT Performance
300 Volts 350 Volts 400 Volts 450 Volts 500 Volts 550 Volts 600 Volts 650 Volts 700 Volts 750 Volts

36
Criteria for the Selection of Voltage Ranges
Lowest CV possible Lowest Voltage possible Highest MFI possible Lowest background possible

37
Example of Optimal PMT Performance & Voltage Selection Criteria (Green B)
Linear Lowest CV Highest S:N Lowest Voltage Ratio = M1/B Linearity = (M2-M1)/M1 Optimal Voltages:
/M1. Optimal Voltages:")
38
Red A (APC-Cy7): Before (30Mar06) & After (10Apr06) Replacing PMT
30 March 2006 10 April 2006 Optimal Voltages: Optimal Voltages: Indeterminate High CV’s; poor S:N

39
Faulty PMT on install… 650 Volts Before After

40
LSRII Qualification Validation Optimization Calibration (“Daily QC”)
Linearity Resolution Signal-to-Noise Ratio (S:N) - LLOD & LLOQ Optimization Select Optimal Voltages for Inst Performance with Assay-Specific Reagents - reduce spillover (Specificity) Establish Assay-Specific Target Channels Calibration (“Daily QC”) Set Daily Voltages Verify Voltages are within acceptable Range (P/F) Verify CVs are within acceptable Range (P/F) Set Target Channels for Specimen Acquisition (P/F) Standardization - Reproducibility/Precision Record Daily Target Channel Values Record Daily Voltages Record Daily CVs Calculate Daily S:N Plot & Review Monthly Trend lines
 - LLOD & LLOQ. Optimization. Select Optimal Voltages for Inst Performance with Assay-Specific Reagents - reduce spillover (Specificity) Establish Assay-Specific Target Channels. Calibration ( Daily QC ) Set Daily Voltages. Verify Voltages are within acceptable Range (P/F) Verify CVs are within acceptable Range (P/F) Set Target Channels for Specimen Acquisition (P/F) Standardization - Reproducibility/Precision. Record Daily Target Channel Values. Record Daily Voltages. Record Daily CVs. Calculate Daily S:N. Plot & Review Monthly Trend lines.")
41
Beads Used for LSRII Optimization
STAINED Comp Beads: validated range in 50v increments (each PMT) Assay Specific fluorescence 1pk Run: Once, then after optical service- “High” flow rate & LOG scale Uses: Optimization Optimize PRIMARY Fluorescence (Primary>Secondary) Unstained Comp Beads: optimized voltages (all PMTs) Non-fluorescent Uses: Validation Check S:N (LLOD & LLOQ) 1x or Midrange Rainbow: optimized voltages (all PMTs) Moderate fluorescence, near cellular expression; Broad Spectrum Ex & Em Run: Once (after optimization) - “High” flow rate & LOG scale Establish Target Channels Linearity: medians = assay specific target channels
 Assay Specific fluorescence. 1pk. Run: Once, then after optical service- High flow rate & LOG scale. Uses: Optimization. Optimize PRIMARY Fluorescence (Primary>Secondary) Unstained Comp Beads: optimized voltages (all PMTs) Non-fluorescent. Uses: Validation. Check S:N (LLOD & LLOQ) 1x or Midrange Rainbow: optimized voltages (all PMTs) Moderate fluorescence, near cellular expression; Broad Spectrum Ex & Em. Run: Once (after optimization) - High flow rate & LOG scale. Establish Target Channels Linearity: medians = assay specific target channels.")
42
Criteria for the Selection Optimal PMT Voltages
The primary fluorescence should be the highest in the respective detector relative to all secondary detectors. Once the ranges are established, voltages are determined based on specific FL. Each detector records a COMP bead profile, which is unique to that detector.

43
Green A: TNF PE-Cy7 460v Baseline & Final

44
Green B: CD8 PerCP-Cy5.5 450v Baseline

45
Green B: CD8 PerCP-Cy5.5 550v Final

46
Green C: CD27 PE-Cy5 350v Baseline

47
Green C: CD27 PE-Cy5 450v Final

48
Green D: CD45RO PE-TR 430v Baseline & Final

49
Green E: MIP1b PE 350v Baseline & Final

50
Duke LSRII Optimization of Specific Fluorescence
Blue Violet Primary Fluorescence Red Secondary Fluorescence Green

51
Neg Comp Beads

52
LSRII Qualification Validation Optimization Calibration (“Daily QC”)
Linearity Resolution Signal-to-Noise Ratio (S:N) - LLOD & LLOQ Optimization Select Optimal Voltages for Inst Performance with Assay-Specific Reagents - reduce spillover (Specificity) Establish Assay-Specific Target Channels Calibration (“Daily QC”) Set Daily Voltages Verify Voltages are within acceptable Range (P/F) Verify CVs are within acceptable Range (P/F) Set Target Channels for Specimen Acquisition (P/F) Standardization - Reproducibility/Precision Record Daily Target Channel Values Record Daily Voltages Record Daily CVs Calculate Daily S:N Plot & Review Monthly Trend lines
 - LLOD & LLOQ. Optimization. Select Optimal Voltages for Inst Performance with Assay-Specific Reagents - reduce spillover (Specificity) Establish Assay-Specific Target Channels. Calibration ( Daily QC ) Set Daily Voltages. Verify Voltages are within acceptable Range (P/F) Verify CVs are within acceptable Range (P/F) Set Target Channels for Specimen Acquisition (P/F) Standardization - Reproducibility/Precision. Record Daily Target Channel Values. Record Daily Voltages. Record Daily CVs. Calculate Daily S:N. Plot & Review Monthly Trend lines.")
53
1x (Target Channel Values)
")
54
Target Channels & Ranges

55
LSRII Qualification Validation Optimization Calibration (“Daily QC”)
Linearity Resolution Signal-to-Noise Ratio (S:N) - LLOD & LLOQ Optimization Select Optimal Voltages for Inst Performance with Assay-Specific Reagents - reduce spillover (Specificity) Establish Assay-Specific Target Channels Calibration (“Daily QC”) Set Daily Voltages Verify Voltages are within acceptable Range (P/F) Verify CVs are within acceptable Range (P/F) Set Target Channels for Specimen Acquisition (P/F) Standardization - Reproducibility/Precision Record Daily Target Channel Values Record Daily Voltages Record Daily CVs Calculate Daily S:N Plot & Review Monthly Trend lines Duke University Medical Center
 - LLOD & LLOQ. Optimization. Select Optimal Voltages for Inst Performance with Assay-Specific Reagents - reduce spillover (Specificity) Establish Assay-Specific Target Channels. Calibration ( Daily QC ) Set Daily Voltages. Verify Voltages are within acceptable Range (P/F) Verify CVs are within acceptable Range (P/F) Set Target Channels for Specimen Acquisition (P/F) Standardization - Reproducibility/Precision. Record Daily Target Channel Values. Record Daily Voltages. Record Daily CVs. Calculate Daily S:N. Plot & Review Monthly Trend lines. Duke University Medical Center.")
56
Daily Calibration Mid-Range or “1x” Rainbow Beads: TC settings
Moderate fluorescence, similar to cells; Broad Spectrum Ex & Em 1pk Run: Morning & Before each Exp - “High” flow rate & LOG scale Uses: Calibration & Standardization Set Assay-Specific Target Channels (TCs) Determine Daily Voltage Settings Daily QC: P/F (CVs, voltages, trends) LSRII Performance Verification for Exp Run: P/F (CVs & TCs) 8 Peak Rainbow & Unstained Comp Beads: TC Settings Non-fluorescent to Very Bright; Broad Spectrum Ex & Em 8pk and 1pk Run: Once Daily - “High” flow rate & LOG scale Uses: Standardization Check Linearity Check S:N (LLOD & LLOQ) Check Specificity Check Resolution Ultra Rainbow Beads: Mean ch ~150,000 VERY Bright; Broad Spectrum Ex & Em Run: Once Daily - “Low” flow rate & linear scale Uses: Manufacturer Recommended Daily QC: P/F (CV & voltages) Check/Adjust Area Scaling Check/Adjust Time Delay Check/Adjust Window Extension Duke University Medical Center
 Determine Daily Voltage Settings. Daily QC: P/F (CVs, voltages, trends) LSRII Performance Verification for Exp Run: P/F (CVs & TCs) 8 Peak Rainbow & Unstained Comp Beads: TC Settings. Non-fluorescent to Very Bright; Broad Spectrum Ex & Em. 8pk and 1pk. Run: Once Daily - High flow rate & LOG scale. Uses: Standardization. Check Linearity. Check S:N (LLOD & LLOQ) Check Specificity. Check Resolution. Ultra Rainbow Beads: Mean ch ~150,000. VERY Bright; Broad Spectrum Ex & Em. Run: Once Daily - Low flow rate & linear scale. Uses: Manufacturer Recommended. Daily QC: P/F (CV & voltages) Check/Adjust Area Scaling. Check/Adjust Time Delay. Check/Adjust Window Extension. Duke University Medical Center.")
57
Daily Standardization
Mid-Range or “1x” Rainbow Beads: Record Daily For each PMT & Scatter CV HV Median Plot Monthly For each PMT & Scatter HV vs Median 8 Peak Rainbow & Unstained Comp Beads: Neg Comp Beads Peak 5 Peak 6 Frequency CV: peak 5 Linearity: Medianpk6-Medianpk5/Medianpk5 Signal:Noise: Medianpk5/MedianNeg Q & B??? Ultra Rainbow Beads: Duke University Medical Center

58
1x Blue B Trend line Duke University Medical Center

59
Ratio and Voltage Variation
The lower ratio at an constant CV could indicate an increase in noise of the PMT, which doe not effect the height of the signal but does effect the S/B ratio and thus the sensitivity of the detector. Duke University Medical Center

60
LASERs have a limited lifespan…

61
Overview Why QC is Important LSRII Optical Configuration LSRII QC
LSRII Validation LSRII Optimization LSRII Calibration LSRII Standardization Practice Analysis?? Duke University Medical Center

62
Example: Stain Index, Qr, and Br Across Laboratories
Example : FITC Channel Lab SI Qr Br 1 77.4 0.015 233 2 134.5 0.028 216 3 55.6 976 4 80.5 0.01 298 5 66 613 6 13.7 0.007 2322 7 16.2 0.018 2768 8 peak beads High SI = Good Resolution; correlates with high Qr and low Br Regarding the instrument performance we have been assessing it by distributing to the labs hard dye beads (like CS&T beads from BD and rainbow 8 peak beads) and lyophilized pre-stained compensation beads (this compensation beads are labeled with each of the fluorochromes that are present in the panels, ie FITC, PE, etc). As you can see in this table we are able to calculated different parameters that are related to instrument performance: With the compensation beads we calculate the Stain Index, a measure of resolution. It takes into account how separate are the + and neg peaks, and how much spread there is in the negative population. A higher stain index means higher resolution. As you can see the SI varies across labs, numbers in red indicating the lower ones. With the CS&T beads we calculated Qr values that are an indication of the efficiency for each detector. A high Q values translates in high resolution. Also with the CS&T beads we can calculate a value called Br that is a reflection of background for each detector. A low B value translates in high resolution. We also looked at the pattern of 8 peak beads. As you can see for example lab 2 has a high stain index and can resolve the 8 peak beads. This very good resolution correlates with a high Q value and a low B. In contrast labs 6 and 7 have low stain index, in the 8 peak beads the peaks at the low end are not resolved and that correlates with low Q values (specially lab 6) and high Br values. Maybe this slide will also benefit from some sort of animation? Low SI = Bad Resolution; correlates with low Qr and high Br Low SI = Bad Resolution; correlates with high Br Impact of Instrument Performance in Quality Assurance of Multicolor Flow Cytometry Assays. Jaimes MC,1 Stall A,1 Inokuma M,1 Hanley MB,1 Maino S,1 D’Souza MP,2 and Yan M.1 ISAC 2010 1BD Biosciences, San Jose, CA 95131; 2Division of AIDS, National Institute of Allergy and Infectious Diseases, National Institutes of Health, Bethesda, MD 20892 62
 and lyophilized pre-stained compensation beads (this compensation beads are labeled with each of the fluorochromes that are present in the panels, ie FITC, PE, etc). As you can see in this table we are able to calculated different parameters that are related to instrument performance: With the compensation beads we calculate the Stain Index, a measure of resolution. It takes into account how separate are the + and neg peaks, and how much spread there is in the negative population. A higher stain index means higher resolution. As you can see the SI varies across labs, numbers in red indicating the lower ones. With the CS&T beads we calculated Qr values that are an indication of the efficiency for each detector. A high Q values translates in high resolution. Also with the CS&T beads we can calculate a value called Br that is a reflection of background for each detector. A low B value translates in high resolution. We also looked at the pattern of 8 peak beads. As you can see for example lab 2 has a high stain index and can resolve the 8 peak beads. This very good resolution correlates with a high Q value and a low B. In contrast labs 6 and 7 have low stain index, in the 8 peak beads the peaks at the low end are not resolved and that correlates with low Q values (specially lab 6) and high Br values. Maybe this slide will also benefit from some sort of animation Low SI = Bad Resolution; correlates with low Qr and high Br. Low SI = Bad Resolution; correlates with high Br. Impact of Instrument Performance in Quality Assurance of Multicolor Flow Cytometry Assays. Jaimes MC,1 Stall A,1 Inokuma M,1 Hanley MB,1 Maino S,1 D’Souza MP,2 and Yan M.1 ISAC BD Biosciences, San Jose, CA 95131; 2Division of AIDS, National Institute of Allergy and Infectious Diseases, National Institutes of Health, Bethesda, MD")
63
Correlation of SI, Qr, and Br with Assay Performance
Lab 2 Lab 4 Lab 6 Lab 7 Plots gated on lymphocytes Plots gated on CD3+ cells How this information on instrument performance translates in assay performance? Here is the data from some of the labs discussed in the previous slide. If you look on the first row at CD3 resolution, you will see that for some labs like lab 7, the distance between + (blue population) and negative (red population) is small compared to other labs (like 6 or 4) meaning that there is a difference on the resolution for this channel. Despite this, in this example all labs will be able to gate in the population of interest. However if you look to the plots in the middle you can see how if the resolution of some population is poor this has an impact on the data. In this case lab 6 has very low resolution for CD8(y axis, green and purple populations are very close compared to other labs) and CD4 (x axis, green and blue population). These problems are shown by the black arrows. Importantly the difficulty at gating on CD8 or CD4 will have an impact on the ability to detect cytokine responses as seen in the data in the bottom row. Plots gated on CD3+CD8+ cells Impact of Instrument Performance in Quality Assurance of Multicolor Flow Cytometry Assays. Jaimes MC, Stall A, Inokuma M, et al. ISAC 2010 63
 and negative (red population) is small compared to other labs (like 6 or 4) meaning that there is a difference on the resolution for this channel. Despite this, in this example all labs will be able to gate in the population of interest. However if you look to the plots in the middle you can see how if the resolution of some population is poor this has an impact on the data. In this case lab 6 has very low resolution for CD8(y axis, green and purple populations are very close compared to other labs) and CD4 (x axis, green and blue population). These problems are shown by the black arrows. Importantly the difficulty at gating on CD8 or CD4 will have an impact on the ability to detect cytokine responses as seen in the data in the bottom row. Plots gated on CD3+CD8+ cells. Impact of Instrument Performance in Quality Assurance of Multicolor Flow Cytometry Assays. Jaimes MC, Stall A, Inokuma M, et al. ISAC")
64
1 Assay – 4 Platforms CD4 V450 CD8 PE CD3 FITC CD20 APC
BD FACSCanto II BD LSR II BD FACSAria III BD LSRFortessa

65
Thank You!!

66
Defining Instrument Performance and Sensitivity: Qr, Br, and SDen

67
Qr: Anti-CD10 PE Example Dim Population
Trans- mission SI Corrected The laser and detectors were attenuated by ND filters over a 30-fold range to illustrate the effects of decreasing detector sensitivity on population resolution. Qr=0.227 100% 83 Qr=0.087 35.5% 55 Qr=0.038 17.8% 35 Qr=0.014 7.1% 20 Qr=0.007 3.5%

68
Relative Background: Br
Br is a measure of true optical background in the fluorescence detector, which helps indicate how easily (dim) signals may be resolved from unstained cells in that detector. Scatter from the flow cell and ambient light. Unbound antibody or fluorochrome Raman scatter Spectral overlap on a cell Cell autofluorescence It measures the variation (CV) of the noise due to optical background. Increased background light broadens the distribution of unstained or dim particles and results in decreased resolution sensitivity. Raman scatter is a scattering of light due to water molecules found in sheath fluid or sample buffer. Raman scattering is highest in the PE parameter for blue laser excitation. Cell autofluorescence is a type of fluorescence that’s inherent to the cell itself being excited by the laser. Factors affecting Br: dirty flow cell, damaged optical component
 signals may be resolved from unstained cells in that detector. Scatter from the flow cell and ambient light. Unbound antibody or fluorochrome. Raman scatter. Spectral overlap on a cell. Cell autofluorescence. It measures the variation (CV) of the noise due to optical background. Increased background light broadens the distribution of unstained or dim particles and results in decreased resolution sensitivity. Raman scatter is a scattering of light due to water molecules found in sheath fluid or sample buffer. Raman scattering is highest in the PE parameter for blue laser excitation. Cell autofluorescence is a type of fluorescence that’s inherent to the cell itself being excited by the laser. Factors affecting Br: dirty flow cell, damaged optical component.")
69
Why is Br important? High Br widens negative and dim populations.
High Qr value = lower resolution Low Qr value = higher resolution Low Br High Br

70
Br: Optical Background from Propidium Iodide
Example: It is common to use propidium iodide (PI) to distinguish live from dead cells. Propidium iodide was added in increasing amounts to the buffer containing beads, and Qr and Br were estimated. PerCP 1000 2000 3000 4000 5000 6000 7000 8000 9000 1 2 3 4 5 6 PI-free dye (µg) Br 0.01 0.02 0.03 0.04 0.05 Qr Residual PI in your sample tube will increase Br, which will reduce sensitivity.
 to distinguish live from dead cells. Propidium iodide was added in increasing amounts to the buffer containing beads, and Qr and Br were estimated. PerCP PI-free dye (µg) Br Qr. Residual PI in your sample tube will increase Br, which will reduce sensitivity.")
71
Electronic Noise (SDen)
SDen is the background signal due to electronics: Contributed by: PMT connections / PMT noise Cables too near power sources Digital error Broadens the distribution of unstained or dim particles Increases in electronic noise results in decreased resolution sensitivity Most important for channels with low cellular autofluorescence APC-Cy™7, PE-Cy™7, PerCP-Cy™5.5 Cy™ is a trademark of Amersham Biosciences Corp. Cy™ dyes are subject to proprietary rights of Amersham Biosciences Corp and Carnegie Mellon University and are made and sold under license from Amersham Biosciences Corp only for research and in vitro diagnostic use. Any other use requires a commercial sublicense from Amersham Biosciences Corp, 800 Centennial Avenue, Piscataway, NJ , USA.

72
Gel (from coupling) found all over the flow cell????
Tiff file missing

73
Contributions to Background Br
Br is a measure of true optical background in the fluorescence detector, which helps indicate how easily (dim) signals may be resolved from unstained cells in that detector. Scatter from the flow cell and ambient light. Unbound antibody or fluorochrome Raman scatter Spectral overlap on a cell Cell autofluorescence It measures the variation (CV) of the noise due to optical background. Increased background light broadens the distribution of unstained or dim particles and results in decreased resolution sensitivity. Raman scatter is a scattering of light due to water molecules found in sheath fluid or sample buffer. Raman scattering is highest in the PE parameter for blue laser excitation. Cell autofluorescence is a type of fluorescence that’s inherent to the cell itself being excited by the laser. Factors affecting Br: dirty flow cell, damaged optical component
 signals may be resolved from unstained cells in that detector. Scatter from the flow cell and ambient light. Unbound antibody or fluorochrome. Raman scatter. Spectral overlap on a cell. Cell autofluorescence. It measures the variation (CV) of the noise due to optical background. Increased background light broadens the distribution of unstained or dim particles and results in decreased resolution sensitivity. Raman scatter is a scattering of light due to water molecules found in sheath fluid or sample buffer. Raman scattering is highest in the PE parameter for blue laser excitation. Cell autofluorescence is a type of fluorescence that’s inherent to the cell itself being excited by the laser. Factors affecting Br: dirty flow cell, damaged optical component.")
78
Grab this slide from the CS&T PPT

79
Get the animated slide from multi-color or CS&T PPT

Similar presentations


, Chandigarh.>")


 Because of long emission spectrum of dyes like FITC and PE.>")


 and 633 (secondary) that.>")
