Download presentation
Presentation is loading. Please wait.

1
Diagnostic canopy Prognostic canopy

3
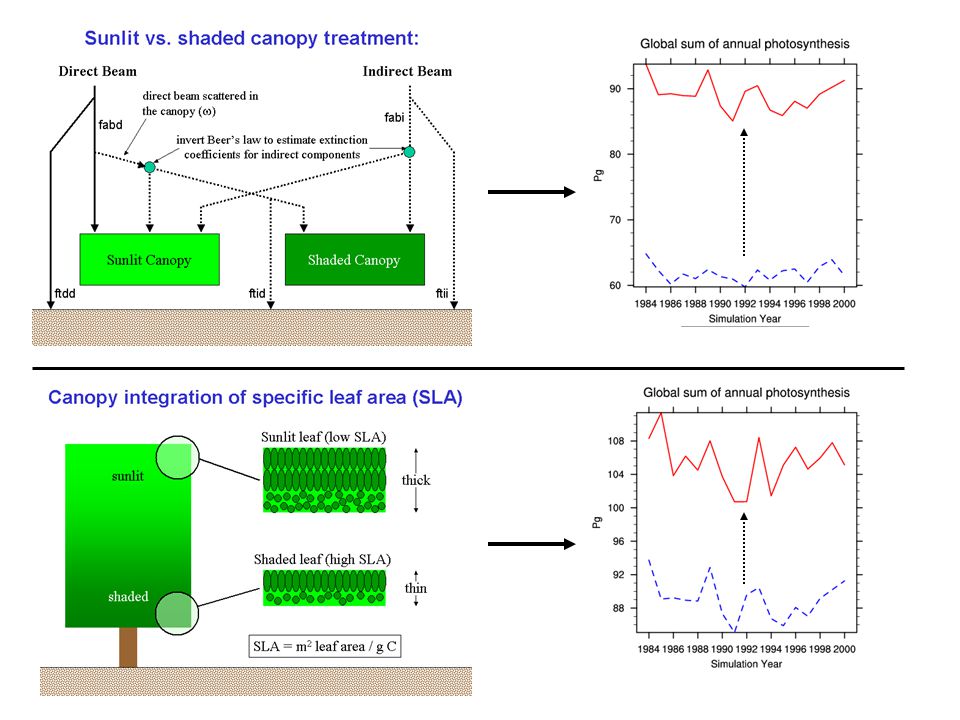
Offline results: Combined influence of sun/shade and prognostic canopy scheme, compared to CLM3.0. CLM3-CN running in C-only mode (N demand met by supplemental N addition on every time step) CLM3.0 CLM3-CN Sun/shade Prognostic canopy Global sum of annual GPP
 CLM3.0 CLM3-CN Sun/shade Prognostic canopy Global sum of annual GPP.")
4
Coupled results: Combined Influence of sun/shade and prognostic canopy scheme, compared to CLM3.0. CLM3-CN running in C-only mode (N demand met by supplemental N addition on every time step) CLM3.0 CLM3-CN Sun/shade Prognostic canopy Global sum of annual GPP
 CLM3.0 CLM3-CN Sun/shade Prognostic canopy Global sum of annual GPP.")
5
Carbon-only dynamics Relative temperature sensitivities typically result in enhanced C source under warming. No direct feedback from decomposition to vegetation growth. P.E. Thornton, NCAR

6
Coupled Carbon-Nitrogen dynamics Strong feedback between decomposition and plant growth: soil mineral N is the primary source of N for plant growth. Can result in a shift from C source to C sink under warming. P.E. Thornton, NCAR

7
CLM3.CN: Summary Model Structure and Fluxes Leaf Fine Root Dead Stem Dead Coarse Root Live Stem Live Coarse Root Previous Storage Current Storage Wood Litter (CWD) Litter 1 (Labile) Litter 2 (Cellulose) Litter 3 (Lignin) SOM 1 (fast) SOM 2 (medium) SOM 3 (slow) Plant Pools Litter Pools Soil Organic Matter Pools
 Litter 1 (Labile) Litter 2 (Cellulose) Litter 3 (Lignin) SOM 1 (fast) SOM 2 (medium) SOM 3 (slow) Plant Pools Litter Pools Soil Organic Matter Pools")
8
The global carbon cycle: fluxes and storage

9
Land-Atmosphere Nitrogen Cycle P.E. Thornton, NCAR

10
Retranslocation Litterfall Plant Uptake Immobilization Fire Losses Deposition/ Fixation Nitrification/ Denitrification Leaching Internal N CyclingExternal N Cycling

11
Coupled

12
P.E. Thornton, NCAR

13
Ndep CO 2 Ndep&CO 2 Ndep+CO 2 Thornton et al., in prep.

14
NEE response to +1° C step change (temperate deciduous broadleaf forest) C-only model Coupled C-N model sink source P.E.Thornton, in prep.
 C-only model Coupled C-N model sink source P.E.Thornton, in prep.")
15
Accelerated Decomposition Spinup Mechanism Thornton and Rosenbloom, accepted

16
(historical SST, ocean fluxes, fossil fuel fluxes) C4MIP – Phase 1 Spinup 1. F-run, 50 y 2. I-run, ~500 y 4. I-run, ~500 y (accelerated decomposition) (normal decomposition) 3. F-run, 50 y 5. F-run, 50 y 5 days 8 days C4MIP – Phase 1 Experiment 1850 Start CO 2 forcing 1870 Start landuse forcing 1890 Start N deposition forcing 19001990 (2000?) F-run: 150 y = 15 days
 (normal decomposition) 3. F-run, 50 y 5. F-run, 50 y 5 days 8 days C4MIP – Phase 1 Experiment 1850 Start CO 2 forcing 1870 Start landuse forcing 1890 Start N deposition forcing (2000 ) F-run: 150 y = 15 days.")
17
Potential GPPActual GPP NPPNet C exchange

19
Ndep = 6.2 Tg N/yr Nfix = 51.6 Tg N/yr N supplement to C-only coupled model (Step 1, F-run)
")
20
gN / m 2 / yr N availability index (blue: N avail is low, red: N avail is high) CCSM3-biogeochemistry coupled result N deposition: 2000N deposition: 2100
 CCSM3-biogeochemistry coupled result N deposition: 2000N deposition: 2100")
21
Treatments Temperature: +1 °C step-change CO 2 : +90 ppmv step-change from pre-industial (from 280 to 370 ppmv) N deposition: 2x pre-industrial Harvest: 50% removal of stem biomass, fine litter and coarse roots stay on site. (Duke Forest, N. Carolina) Integrated effects of climate change, CO 2, nitrogen deposition, and disturbance on components of the carbon cycle
 Integrated effects of climate change, CO 2, nitrogen deposition, and disturbance on components of the carbon cycle.")
22
Harvest loss: 11278 gC m -2

Similar presentations


 II.C-cycle overview: pools & fluxes (Ch. 6) III. Controls on GPP (Ch. 5) IV.Controls.>")
 Autumn Sun 1.>")
 II.C-cycle overview: pools & fluxes (Ch. 6) III. Controls on GPP (Ch. 5) IV.Controls.>")

 I.What is it? II.Who does it? III.What controls it? IV.How does it fit into the big picture?>")