Download presentation
Presentation is loading. Please wait.

1
Slavery Myths and Realities John Sacher jsacher@mail.ucf.edu

2
Myth #1 Slavery permeated all areas of the South.

3
Slave Population—1860 SlavesTotal PopulationSlave % Virginia 490,865 1,596,318 31% Georgia 462,198 1,057,28644% Mississippi436,631 791,305 55% Alabama 435,080 964,20145% South Carolina 402,406 703,70857% Louisiana331,726 708,00247% North Carolina 331,059 992,62233% Tennessee275,7191,109,80125% Kentucky225,4831,155,68420% Texas182,566 604,21530% Missouri 114,9311,182,01210% Arkansas111,115 435,45026% Maryland 87,189 687,04913% Florida 61,745 140,42444% Delaware 1,798 112,216 2%

4
Slave Population—1860 SlavesTotal PopulationSlave % South Carolina 402,406 703,70857% Mississippi436,631 791,305 55% Louisiana331,726 708,00247% Alabama 435,080 964,20145% Georgia 462,198 1,057,28644% Florida 61,745 140,42444% North Carolina 331,059 992,62233% Virginia 490,865 1,596,318 31% Texas182,566 604,21530% Arkansas111,115 435,45026% Tennessee275,7191,109,80125% Kentucky225,4831,155,68420% Maryland 87,189 687,04913% Missouri 114,9311,182,01210% Delaware 1,798 112,216 2%

5
Slave Distribution

6
Myth #2 Almost all slaves produced cotton.

7
Cotton—4.5 million bales (1860)
")
8
Cotton Gin

9
Where did slaves work? Cotton 55 percent Tobacco 10 percent Sugar/rice/hemp 10 percent Servants 15 percent Trades/industry 10 percent

10
Slave Crops

11
Myth #2a Slaves performed similar tasks regardless of where they worked.

12
PLANTATION ORGANIZATION A. Gang System Owner—Planter (owns 20+ slaves) Overseer—Day-to-day authority figure Driver—Slave Foreman Field Hand—Men and women B. Task System
 Overseer—Day-to-day authority figure Driver—Slave Foreman Field Hand—Men and women B. Task System.")
13
Plantation Layout

14
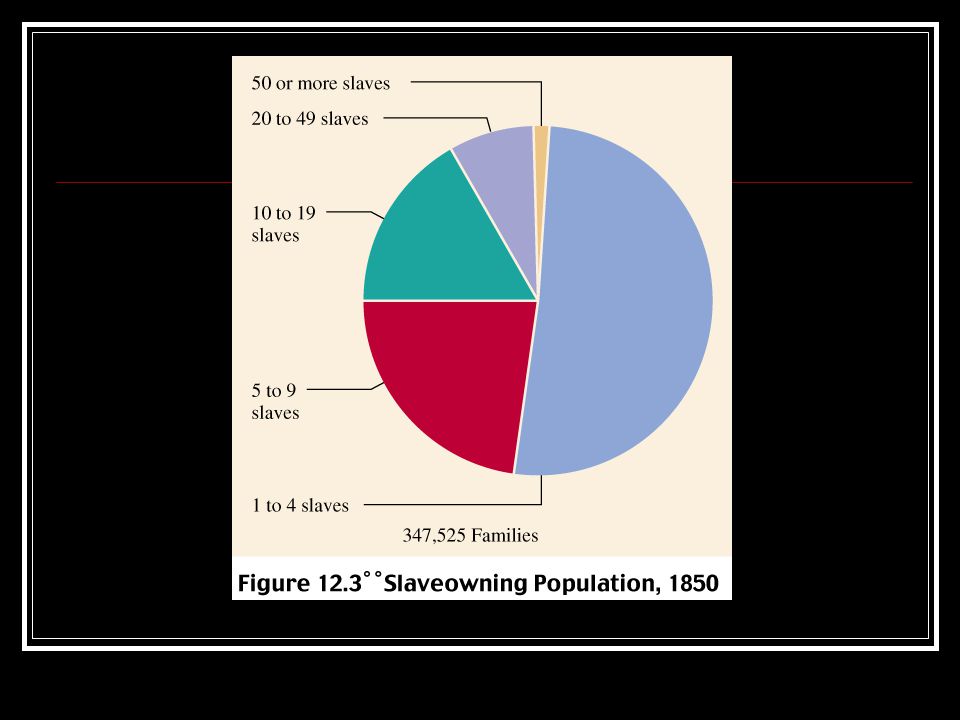
Myth #3 The South was a land of plantations and slaves.

15
Some Figures: In 1860, in the slave states, there were 8 million whites who owned 4 million slaves. The number of slaveholders in 1860— approx. 387,000 In other words, only approximately 5% of all whites owned slaves.

16
How Many People Owned Slaves?

17
RATIO OF SLAVEHOLDERS TO FAMILIES, (1860) STATE:SLAVEHOLDERS TOTAL FAMILIES PCT MISSISSIPPI30943 6301549 SOUTH CAROLINA 26701 58642 46 GEORGIA 41084 109919 37 ALABAMA 33730 96603 35 FLORIDA 5152 15090 34 LOUISIANA 22033 74725 29 TEXAS 21878 76781 28 NORTH CAROLINA 34658 125090 28 VIRGINIA 52128 201523 26 TENNESSEE 36844 149335 25 ARKANSAS 11481 57244 20 Total 316632 102796731
 STATE:SLAVEHOLDERS TOTAL FAMILIES PCT MISSISSIPPI SOUTH CAROLINA GEORGIA ALABAMA FLORIDA LOUISIANA TEXAS NORTH CAROLINA VIRGINIA TENNESSEE ARKANSAS Total")
19
Myth #4 Southern law and southern owners were consistent in defining the status of slaves.

20
Slave Codes

21
The Whip

22
Myth #5 By 1860, slavery was unprofitable and dying out.

23
Value of Southern Crops Tobacco 1849—106 million lbs. 1859—347 million lbs. Rice 1849—215 million lbs. 1859—187 million lbs. Sugar 1849--$60 million 1859--$180 million Cotton 2.5 million bales to 4.5 million bales

24
Slave Prices

25
Slave Sales

26
And, while we’re on the subject of the slave trade….Myth #5a The international slave trade went primarily from Africa to the American colonies.

27
Slave Trade

28
Some comparative figures…. To United States To Saint Domingue To 1790275,000Total 860,000 1790-1807 75,000Alive in 1791= French & 480,000 Span. Terr. 30,000 Illegal (est.) 50,000 430,000 1800 1 million, 1860 4 million in US
 50, , million, million in US.")
29
Myth #6 Given the lack of rebellions, one can conclude that most slaves accepted slavery.

30
Nat Turner’s Rebellion

31
Charles Ball “I was never acquainted with a slave who believed, that he violated any rule of morality by appropriating to himself any thing that belonged to his master, if it was necessary to his comfort.”

32
Slave “Diseases” Drapetomia Dysaethesia Aethiopica

33
Underground Railroad Runaway Slave Ad

34
Runaway Slaves

Similar presentations