Download presentation
Presentation is loading. Please wait.

2
DENTAL CARIES AND FLUOROSIS IN DIFFERENT DRINKING WATER FLUORIDE LEVELS IN 7-12 YEAR OLD STUDENTS OF FORG DISTRICT OF DARAB. DR. HEIDAR KHADEMI ASSISTANT PROFESSOR OF ORAL MEDICINE DEPARTMENT SCHOOL OF DENTISTRY OF ISFAHAN MEDICAL SCIENCES UNIVERSITY AND HEALTH SERVICES,IRAN

3
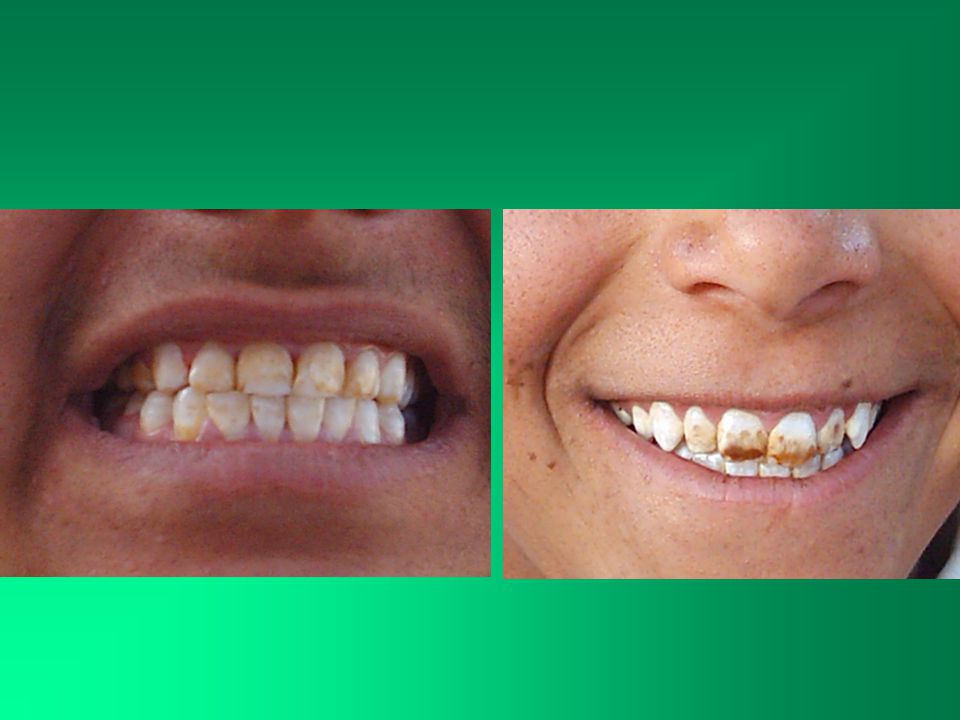
INTRODUCTION Fluoride has played a central role in oral health promotion for the past 50 years but the ingestion of excessive fluoride during tooth development particularly at the maturation stage,may result dental fluorosis,which has a extensive range of clinical sign.

5
The classical studies of DEAN and DEAN et al conducted in the USA provided the basis for the generally accepted rule that optimal dental protection and minimal dental fluorosis are associated with drinking water fluoride level of about 1p.p.m

7
Traditionally an inverse relationship has been found between the concentration of fluoride in drinking water and caries experience,where as insignificant fluorosis associated with approximately,1 p.p.m fluoride in drinking water.

9
Many investigations showed that enamel fluoride level,caries experience and dental fluorosis score vary from one population to another. Additional factors responsible for these variations are dietary fluoride intake,climate, systemic and topical fluoride adminstration,socio-economic status, any factor that decrease urinary pH,temperature and altitude.

11
Despite the fact this study was conducted and the aim of this research was to determine the relationship between caries experience,degree of fluorosis and different concentrations of fluoride in the drinking water (range.07-1.8 mg-L) of school children in FORG district who had lived there since birth.
 of school children in FORG district who had lived there since birth.")
12
REVIEW OF LITRATURES 2000 CHENG H CHINA 1527 AGED 6-15 2001 GROBLER SOUTH AFRICA 282 AGED 10-15 2.7 P.P.M 2002 BUDIPRAMANA INDONESIA 477 AGED 6-12 0.51 3.15 PPM 2002 WHELTON IRELAND 17851 8 12 2003 ERMIS TURKEY 278 12 14 2004 JANAKIRMA CHANDRASHEKAR INDIA 1131 12-15 0.22-3.14PPM 2004 MARINO CHILE 421 6-9 2004 JUDITH UK AND WONDWOSSEN ETHIOPIA

14
Prevalence of dental fluorosis in Iran In some parts of our country for example.FARS,BUSHEHR,some parts of HORMOZGAN,YAZDprovinces the level of fluoride in drinking water is over optimum and the incidence of dental fluorosis is high, but in northern area has no fluorosis.

16
FORG DISTRICT Consist of 11 village Population:15000 Location:130km south of Darab 850m above see level Temperature:Max 46 c Job: agriculture Production: fruits specially date

19
This was a cross sectional study and the goals were determining of fluorosis and comparing DMF score in 11 area mentioned above.Totally 934 school children(469 boys 50.2%,465 girls 48.8%)aged 7-12year old were selected and were examined for dental caries (DMF WHO 1997 ORAL HEALTH CRITERIA) and Dean's index for dental fluorosis degree. Necessary information including age,sex,DMFscore,F score,Fluoride levels in drinking water were collected in a QUESTIONAIRE form and then results were statistically analyzed by student T TEST.

20
CRITERIA FOR DEAN,S FLUOROSIS INDEX DIAGNOSIS CRITERIA 0-_Normal The enamel represent the usual translucent semivitriform type of structure. The surface is smooth,glossy,and usually of a pale creamy white color. 1-Questionable The enamel discloses slight aberrations from the translucency of normal enamel, ranging from a few white flecks to occasional white spots. This classification is utilized in those instances where a definite diagnosis of mildest form of fluorosis is not warranted and a classical of normal not justified. 2-Very mild small opaque,paper white area scattered irregularly over the tooth but not involving as much as approximately 25% of the tooth surface. Frequently included in this classification are teeth showing no more than 1 to 2 mm of white opacity at the tip of the summit of the cusps of bicuspids or second molars. 3-Mild The white opaque areas in the enamel of the teeth are more extensive but do not involve as much as 50 of the teeth. 4-Moderate All enamel surfaces of the teeth are affected, and surfaces subject to attrition show marked wear. Brown stain is frequently a disfiguring feature. 5-Severe Includes teeth formerly classified as moderately severe and severe.All enamel surfaces are affected and hypoplasia is so marked that the general form of the tooth may be altered.The major diagnostic sign of this classification is the discrete or confluent pitting. Brown stains are widespread,and teeth often present a corroded appearance.

22
AreaNumber F. Concentration in drinking water mg/l shahzakaria491.8 Fadami1950.86 Ghalatoeh701.8 mars1480.85 Bostan340.52 mehrabad281.8 Ghalae nov921.5 Doborgi1500.7 shahmarz981.2 Mohammed abad221.8 Nasir abad481.5 Table 1 : Frequency of distribution of students area according to fluoride levels in drinking water of Areas and the number of the students

24
F. Concentration Mg/l NumberMean DMFSD DMF 0.71502.502.40 0.82341.472.30 0.851481.181.68 0.861951.892.05 1.21471.601.98 1.51401.341.92 1.81200.921.45 کل9341.612.03 Table 2: Comparison of mean DMF according to fluoride concentration in drinking water P < 0.01 Significant

26
: :

27
Fig 1: Comparison of mean DMF according of fluoride concentration in drinking water of arias (P<0.01) correlation R 5.3 Significant
 correlation R 5.3 Significant")
29
SD DMFMean DMFNumber Mean DMF F Concentration 2.141.84527<1 mg/l 1.941.482831.01-1.5 1.450.92120> 1.5 mg/l Table 3: Comparison of mean DMF according to F Concentration

30
F. Concentration Severity of fluorsis NumberMean DMFSD. DMF Normal 832.632.74 Question able 1432.392.28 Very mild 3051.481.92 Mild 1821.341.70 Moderate 1720.791.28 severe 442.522.12 Total 9341.612.03 Table 4: Comparison of mean DMF according to severity of fluorosis

32
DMF Age 012345678910Total 7 years643421 12553111167 8 years63212715168 8311180 9 years 7926251413741200171 10 years 9036382218762201222 11 years 1192118136221001183 12 years 8101001000011 Total4231261428665293415824934 Table 5: Comparison of DMF according to age in students of areas P < 0.01 Significant

34
Severity of fluorosis age NormalQuestion ableVery mildMildModeratesevereTotal 7 years30297121115167 8 years20424838275180 9 years10245441384171 10 years132769514913222 11 years92061304617183 12 years11216011 Total8314330518217744934 Table 6 : Dental fluorosis in students according to age

35
F. Concentration Severity of fluorsis < 1 mg/l 1.01 – 1.5 mg/l > 1.5 Normal 91.6%8.4%0% Question able 86.7%12.6%0.7% Very mild 73.1%21.3%5.6% Mild 44.5%41.2%14.3% Moderate 12.4%54.8%32.8% severe 2.3%56.8%40.9% Table7: Dental fluorosis score by fluoride area P < 0.01 Significant

37
Totally 934 school children were selected.In 508 they had problem with their teeth. We observed that DMF mean was reduced by increasing water fluoride and also by increasing fluorosis grade the DMF score was decreased.

40
Table 8 Comparison of present study with other studies Through out the world AriaNumberMean DMFFluorosis year India 4001.9224%1984 (Boshehr) IRAN 5071.885%1999 China 1527-73%2000 Indonesia 4704 Relationship fluorosis Not siginificant DMF 2002 Greece 300-61%2004 chile 4211.8616.2%2004 India 1131-13.2%2004 Present study 9341.6175.8%2005
 IRAN %1999 China %2000 Indonesia 4704 Relationship fluorosis Not siginificant DMF 2002 Greece %2004 chile %2004 India %2004 Present study %2005")
41
In this study we saw that DMF score and water fluoride had indirect relation and also with flurosis grade. It is advised that we determine fluoride concentration in drinking water and eating behaviors in every population separately to reduce risk of fluorosis and dental decay and problems.

43
SUGGESTIONS 1:Encourage to take oral hygiene 2:Fluoride mouth wash 3:Fluoridation of drinking water in area less than1P.P.M 4:Defluoridation of drinking water in area which is over optimum.

45
. AKNOWLEDGMENT We would like to appreciate the financial support of VICE CHANCELLOR OF ISFAHAN Medical sciences university and health services (MOI).
.")
46
Thank you for your attention

Similar presentations


 anomalies of teeth. Developmental anomalies of teeth are marked deviations from the normal standards in color, contour, size,>")


.>")


