Download presentation
Presentation is loading. Please wait.

1
How to read a Topographic Map
By: Shauna Lilienthal

2
Table of Contents Introduction What is a topographic map Contour and Isolines Scale Symbols The map of Mora Reading the scale Reading symbols Township and Range What is township and range Visual of township and range Using township and range

3
What this power point is about:
We will be going through three main parts. The first part will be, “what is a topographic map?” We will explore the big picture as well as different things to remember about a topographic map. The second part will be the map of Mora. When we know what a map is, we will point out specific things on the map of Mora. Finally, we will explore township and range and locate specific places on the map of Mora.

4
What is a topographic map?
A topographic map is a zoomed up area. It is created by isolines showing the earth’s elevation. Contour lines are line points above sea level.

5
Here is a closer look at the same map
Here is a closer look at the same map. The lines shown are contour lines. Down at the bottom is a scale, showing how the lines are represented. On this map, the contour interval (space between the lines) is 20 feet. Each line represents a change in elevation.
 is 20 feet. Each line represents a change in elevation.")
6
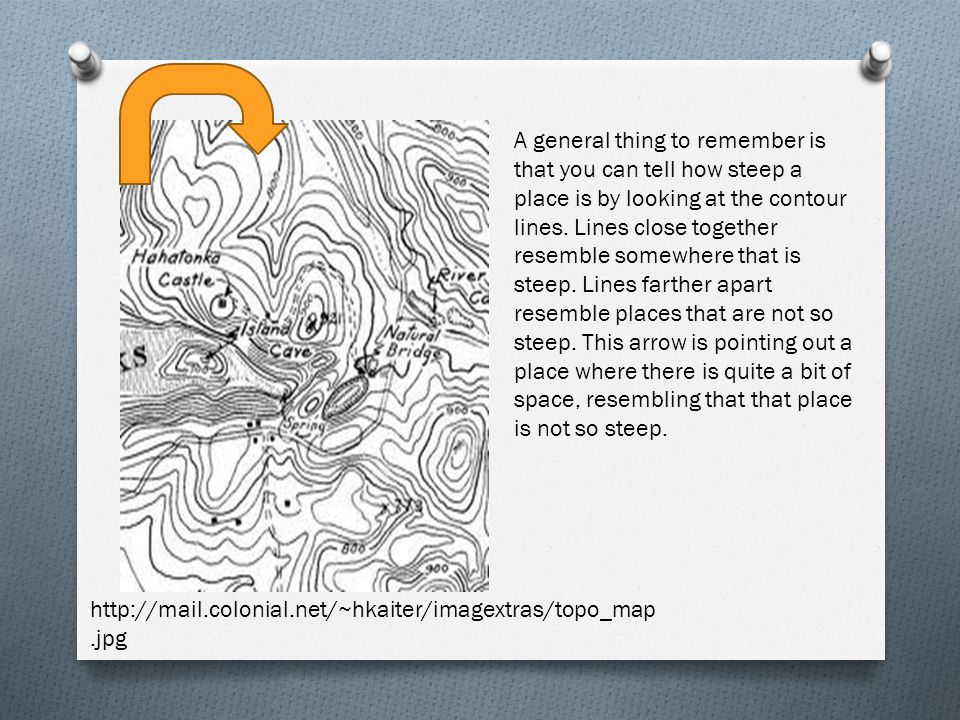
A general thing to remember is that you can tell how steep a place is by looking at the contour lines. Lines close together resemble somewhere that is steep. Lines farther apart resemble places that are not so steep. This arrow is pointing out a place where there is quite a bit of space, resembling that that place is not so steep.
7
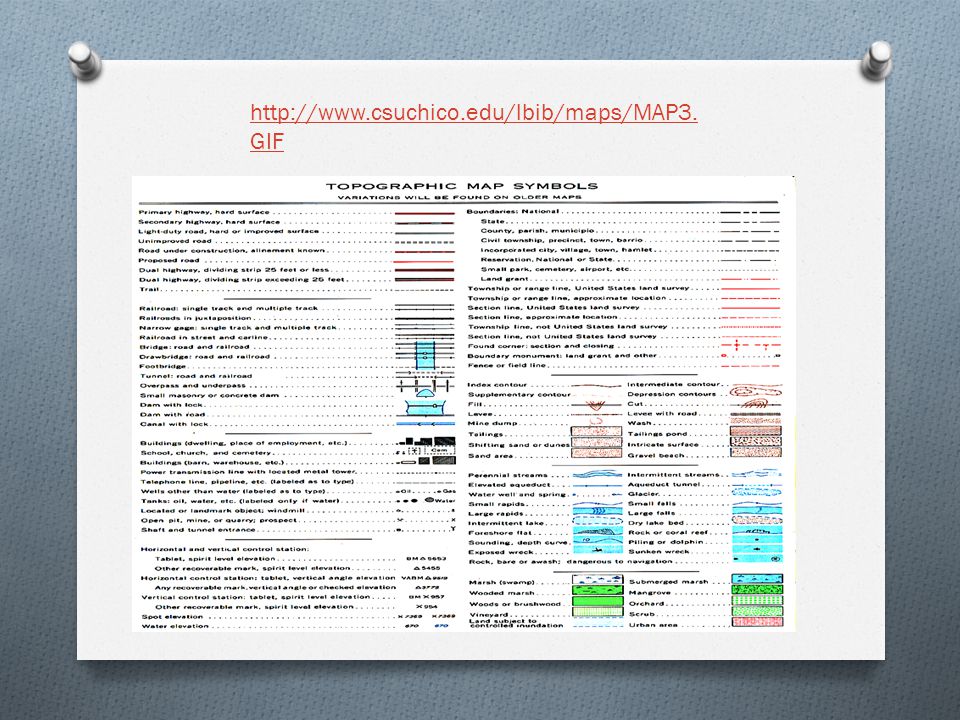
Symbols In the following slides are symbols that you will most likely see on topographic maps. Whenever the lines are represented in this manner, means that is how the earth elevations goes.

8
This symbol represents a hill
This symbol represents a hill. The smallest circle is the peak of a hill.

9
This is part of a depression. Circles with slashes in it is the symbol
This is part of a depression. Circles with slashes in it is the symbol. These are lower levels of elevation.

10
Another thing to remember, is that whenever a line crosses the path of a river, it automatically points upward. That shows where valley’s are at. It makes a “V”.

12
To find out more symbols, you can find “symbol pages”
To find out more symbols, you can find “symbol pages”. Pages with symbols will differ, depending on where you find them at. The previous page was an example of what some of them look like.

13
Here is a topographic map of Mora, MN.
Here is a topographic map of Mora, MN.

14
Taking what we learned, we will look at specific locations in the map of Mora. I will point out different areas, following symbols, lines, ect.

15
Here is the scale. 1:24,000

16
Lake Marsh Hill River

17
Another thing still yet to mention is Township and range
Another thing still yet to mention is Township and range. The purpose of township and range is to give land a government setting and a means to sell land from it. The system by which it is measured by is from the United States Public Land Survey. It is divided by the latitude and longitude line. A square, 6X6 miles long, equals one township. The range is measured from east to west.

18
Below is a drawn example of how a township is measured.
Longitude T 1 N Latitude T 1 S The little orange boxes would keep adding up. You would keep counting them by T1N, T2N, ect. Then you go from side to side to figure out the range. The blue box would be T1S RSE.

19
To make it even more specific, each square is cut off into 1/4ths
To make it even more specific, each square is cut off into 1/4ths. Then you add direction to them. NW ¼. That would mean it is the top, left corner. X To describe a township, you start from the littlest factors and mount up to the biggest factors. EXAMPLE : NW ¼, Section 32, T15, R21W However, if you wish to find one on a topographic map, you would follow them backwards: from the largest to the smallest.

20
On the corners of topographic maps are little red numbers and letters showing the township range that topographic maps cover.

21
34 35 36 Within the squares are little red numbers representing the numbers as you move from square to square. If the numbers are in sequence, 34,35,36, ect That means it is the same townships. When the numbers jump you have moved to a new range. SAME TOWNSHIP 28 NEW TOWNSHIP

22
We will follow the factors from big to little to see what lies at
SW ¼, S 36, T41N, R24W on the Mora map. Here are the ranges. We want R. 24W

23
Now we find T 41N and follow it to section 36.

24
Once you find section 36, mentally square the section off into four even corners. Then we would look to the South-West ¼. We have found Hillman Baptist Church!

25
And that is how you read a topographic map!!

26
Bibliography : Media – Music – McCreery, Scotty, Water Tower Town. Clear as Day. Interscope records, 2011. Information : Everything written was learned from Professor Knapp’s Physical Geography

Similar presentations