Download presentation
Presentation is loading. Please wait.

1
Suman Majumdar Department of Astronomy and Oskar Klein Centre Stockholm University Redshift Space Anisotropies in the EoR 21-cm Signal: what do they tell us about the sources of reionization?

2
Collaborators o Hannes Jensen, Kai Yan Lee, Garrelt Mellema (Stockholm University, Sweden) o Kanan K. Datta (Presidency University, India) o Ilian T. Iliev (University of Sussex, UK) o Emma Chapman, Filipe Abdalla (University College London, UK) ……………………
 o Ilian T. Iliev (University of Sussex, UK) o Emma Chapman, Filipe Abdalla (University College London, UK) …………………….")
3
90

4
Robertson et al., 2013, ApJ, 768, 1Mitra et al., 2012, MNRAS, 419, 2 Present constraints From WMAP, SPT, QSO, LAE/LBG,.....

5
90 WHO? WHEN? HOW? !!A Murder Mystery!!

6
90 HI 21-cm Radiation !!Time Travel!!

7
GMRT MWA LOFAR SKA

8
Direct Probe of Reionization Timing and duration of EoR Properties of EoR Sources IGM Properties Large scale distribution of HI Physical Processes involved 90 HI 21-cm Radiation !!Time Travel!!

9
Probable first detection would be via --- “Variance” “Spherically Averaged Power Spectrum” Patil et al., 2014, MNRAS, 443, 2Pober et al., 2014, ApJ, 782, 2

10
Redshift Space Distortion Line of Sight

11
Redshift Space Distortion Line of Sight Real Space Redshift Space

12
Redshift Space Distortion Line of Sight Real Space Redshift Space

13
Power Spectrum in Redshift Space Observed power spectrum will be “anisotropic” (or LoS dependent). LoS θ k

14
Power Spectrum in Redshift Space Effect of this anisotropy on the 21-cm power spectrum will be significant. LoS θ k o Bharadwaj and Ali, 2004, MNRAS, 352, 142 o Bharadwaj and Ali, 2005, MNRAS, 356, 4 o Barkana and Loeb, 2005, ApJL, 624, L65

15
Power Spectrum in Redshift Space Considering the model with quasi-linear approximations ---- Mao et al., 2013, MNRAS, 2012, 422, 2

16
Power Spectrum in Redshift Space Considering the model with quasi-linear approximations ---- Mao et al., 2013, MNRAS, 2012, 422, 2 Power Spectrum of Matter Density Field

17
Power Spectrum in Redshift Space Considering the model with quasi-linear approximations ---- Mao et al., 2013, MNRAS, 2012, 422, 2 Power Spectrum of HI Density Field

18
Power Spectrum in Redshift Space Considering the model with quasi-linear approximations ---- Mao et al., 2013, MNRAS, 2012, 422, 2 Cross-Power Spectrum of HI and Matter Density Field

19
Power Spectrum in Redshift Space Jensen et al., 2013, MNRAS, 435, 1

20
Power spectrum in Redshift Space Kaiser, N., 1987, MNRAS, 227, 1 Hamilton, A. J. S., 1992, APJL, 385, L5

21
Legendre Polynomial Power spectrum in Redshift Space Kaiser, N., 1987, MNRAS, 227, 1 Hamilton, A. J. S., 1992, APJL, 385, L5

22
Angular Multipoles Power spectrum in Redshift Space Kaiser, N., 1987, MNRAS, 227, 1 Hamilton, A. J. S., 1992, APJL, 385, L5

23
Angular Multipoles Power spectrum in Redshift Space Kaiser, N., 1987, MNRAS, 227, 1 Hamilton, A. J. S., 1992, APJL, 385, L5

24
Majumdar, Bhardwaj & Choudhury, 2013, MNRAS, 434, 3 Majumdar et al., 2014, MNRAS, 443, 4 Model with Quasi-linear Approximations

25
Blessing in disguise!!! Redshift Space Distortions Barkana and Loeb, 2005, ApJL, 624, L65

26
Monopole (l=0) and Quadrupole (l=2) Majumdar, Bhardwaj & Choudhury, 2013, MNRAS, 434, 3 Majumdar et al., 2014, MNRAS, 443, 4
 and Quadrupole (l=2) Majumdar, Bhardwaj & Choudhury, 2013, MNRAS, 434, 3 Majumdar et al., 2014, MNRAS, 443, 4")
27
Monopole (l=0) and Quadrupole (l=2) Majumdar, Bhardwaj & Choudhury, 2013, MNRAS, 434, 3 Majumdar et al., 2014, MNRAS, 443, 4
 and Quadrupole (l=2) Majumdar, Bhardwaj & Choudhury, 2013, MNRAS, 434, 3 Majumdar et al., 2014, MNRAS, 443, 4")
28
Monopole (l=0) and Quadrupole (l=2) Majumdar, Bhardwaj & Choudhury, 2013, MNRAS, 434, 3 Majumdar et al., 2014, MNRAS, 443, 4 Will these observables behave differently for different source models?
 and Quadrupole (l=2) Majumdar, Bhardwaj & Choudhury, 2013, MNRAS, 434, 3 Majumdar et al., 2014, MNRAS, 443, 4 Will these observables behave differently for different source models")
29
Simulation o DM distribution: P 3 M N-body simulation o Box size: (714.28 Mpc) 3 o Minimum halo mass used: 2.02x10 9 M sun o 21-cm brightness temperature fields: Excursion set based semi-numerical formalism (on a 600 3 grid) o Assumption: T S >> T γ o All source models are tuned to have same reionization history (i.e. x HI vs z)
.")
30
Source Models o Fiducial: 100% UV (Global inside-out) o Clumping: Fiducial with approx. self shielding criteria o Hard X-ray dominated : x% UV + y% H o Soft X-ray dominated: x% UV + y% S o Hard+Soft X-ray: x% UV + y% H + z% S o Sources with power law response: No. of photons ∝ (halo mass) n o Sources of a limited halo mass range
 n o Sources of a limited halo mass range.")
31
21-cm Maps in Redshift Space mK LoS FiducialClumpingUV 20%, H 80% UV 20%, S 80%UV 50%, S 40%, H 10% Pl = 3

32
Monopole or Spherically avg. Power spectrum

33
Quadrupole (l=2)
")
35
Quadrupole (l=2)/ Monopole(l=0)
/ Monopole(l=0)")
36
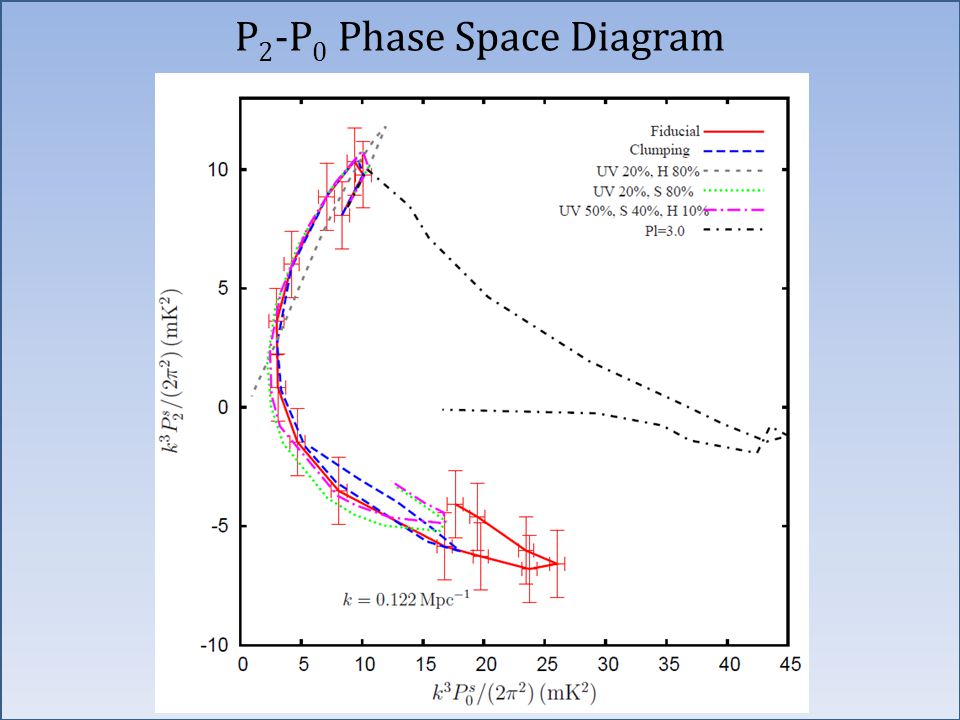
P 2 -P 0 Phase Space Diagram

38
Conclusions: o Even with the exactly same reionization history (x HI vs z) different source models will trace different trajectories in the phase space of P 2 – P 0. o However, the differences between the different trajectories (for some of the source models) compared to that of the fiducial model could be very small. o A significant contribution (≤50%) from a uniform ionizing background will be difficult to rule out from these measurements due to this degeneracy. o A huge (~80%) contribution from a uniform ionizing background should be easy to rule out. o Reionization driven by extremely massive sources will trace a uniquely different trajectory in this phase space than the fiducial model.
 compared to that of the fiducial model could be very small. o A significant contribution (≤50%) from a uniform ionizing background will be difficult to rule out from these measurements due to this degeneracy. o A huge (~80%) contribution from a uniform ionizing background should be easy to rule out. o Reionization driven by extremely massive sources will trace a uniquely different trajectory in this phase space than the fiducial model..")
39
감사합니다

40
Reionization History

41
Power Spectrum of the Signal P(k) = |A(k)| 2 k = 2Π/L
 = |A(k)| 2 k = 2Π/L")
42
Signal (in image plane)
")
43
21-cm Line pe p e 21 cm 1420 MHz ν o = 1420 MHz/(1+z) λ o = 21 (1+z) cm
 λ o = 21 (1+z) cm")
44
90 HI 21-cm Radiation !!Time Travel!!

45
Radio Interferometry “Visibility” = FT of Sky Brightness Temp.

46
Radio Interferometry “Visibility” Signal NoiseForegrounds

47
21-cm Brightness Tempereture Underlying Matter Density Field + State of the Hydrogen

48
Underlying Matter Density Field + State of the Hydrogen Cosmology 21-cm Brightness Tempereture

49
Underlying Matter Density Field + State of the Hydrogen Cosmology Astrophysics 21-cm Brightness Tempereture

50
Underlying Matter Density Field + State of the Hydrogen Cosmology Astrophysics 21-cm Power Spectrum 21-cm Brightness Tempereture

51
Comparison Cross-correlation with C 2 - RAY :- (in real space)
")
Similar presentations

, Barcelona. Instituto de Astrofísica.>")

 LANL Cosmology School, July 2011 Review: constraints on IGM during reionization CMB large scale.>")


>")


, A. Ferrara (SISSA), I. Iliev (CITA), P. Madau (UCSC), A. Maselli (MPA), F. Miniati.>")


,>")
 Harvard (Hubble fellow) COSMO 2014 August 2014, Chicago.>")


