Download presentation
Presentation is loading. Please wait.

1
Techniques for Measuring Feed Protein Digestion and Microbial Protein Synthesis
To establish the amounts and ratios of nutrients necessary for optimal microbial and animal response, one must first adequately predict the degree to which nutrients are made available in the rumen from a variety of dietary ingredients

2
Laboratory estimates of protein degradability
Solubility in buffer and detergents Incubation in controlled artificial rumen fermenter Incubation with proteolytic enzymes

3
In vitro : Samples are ground (1-mm screen) weighed into duplicate 50-ml centrifuge tubes Five milliliters of McDougall’s buffer (14) are added to each sample allowed to soak for 60 to 90 min at 39°C
 are added to each sample. allowed to soak for 60 to 90 min at 39°C.")
4
In vitro : Duplicate samples are incubated for 0 and 4 h at 39°C after addition of 10 ml of RF buffer inoculum Inhibitor concentrations are 1.0 mM hydrazine and 30 mg of chloramphenicol/ml,which are added to suppress microbial uptake of NH3 and TAA Incubations are stopped by the addition of 5% (wt/vol) TCA and placement of the tubes on ice for 30 min
 TCA and placement of the tubes on ice for 30 min.")
5
In vitro : samples are centrifuged (15,300* g at 4°C for 15 min) supernatant fractions are stored at 4°C supernatant fractions analyzed for NH3 and TAA by a semiautomated method

6
In vitro : Degraded CP fraction (A0) , defined as the proportion of total N present as NH3 and TAA at 0 h Potentially degradable CP fraction present at 0 h ( B0 ) was defined as 100 – A0 CP fraction remaining undegradedat 4 h ( B4 ) was defined as 100 – A4 (A4 ): defined as the proportion of total N present as NH3 and TAA at 4 h
 was defined as 100 – A0. CP fraction remaining undegradedat 4 h ( B4 ) was defined as 100 – A4. (A4 ): defined as the proportion of total N present. as NH3 and TAA at 4 h.")
7
The degradation rate(kd)
kd = (ln B4 –ln B0 )/4 h. ruminal CP escape B0(kp /(kd +kp )) + C
/4 h. ruminal CP escape. B0(kp /(kd +kp )) + C.")
8
Pepsin·HCl Five grams (air-dried basis) of ground sample are weighed in duplicate into folded placed into ether extraction cylinders; and extracted for 72 h to remove lipid dried for 24 h in a 60°C forced air oven weighed into 200-ml teflon-capped jars

9
Pepsin·HCl Fresh prewarmed (42 to 45°C) pepsin solution is added to each jar Jars are laid in a 45°C incubator-shaker for 16 h. After incubation allowed to sit for 15 min Residues are filtered

10
Pepsin·HCl Residues and filter papers are rinsed with acetone dry over-night in a 60°C forced-air oven transfer directly to Kjeldahl flasks digestible CP = [1 – (residual CP/total CP)] * 100
] * 100.")
11
TABLE 1. Composition and estimated digestibilities of animal by-product

12
In situ/In sacco Techniques
In situ = In place In sacco = In bag Suspend a bag containing feed in rumen or cecum Mobile nylon bag- placed into duodenum and collected at ileum +/or feces

13
In situ nylon bag technique (in sacco technique)
Used to determine degradation of protein in protein supplements and basal feeds. Requires rumen cannulated animals. Feedstuffs contained in bags made from polyester (nylon) cloth are incubated in the rumen for a range of times, and the degradation loss for each incubation time is measured. The in situ nylon bag technique allows intimate contact of the test feed with the rumen environment including temperature, pH, buffer, substrate, enzymes, although when incubated within the rumen, the feed is not subject to the total rumen experience (mastication, rumination, and passage).
 cloth are incubated in the rumen for a range of times, and the degradation loss for each incubation time is measured. The in situ nylon bag technique allows intimate contact of the test feed with the rumen environment including temperature, pH, buffer, substrate, enzymes, although when incubated within the rumen, the feed is not subject to the total rumen experience (mastication, rumination, and passage).")
14
Nylon pose / ”In situ” - metode

17
Recommended guidelines for ruminal in situ degradation procedures
Bag porosity 40 to 60 m Particle size Protein supplements, 2-mm Whole grains, hays and silages, 5-mm Sample size to bag surface area 10 to 20 mg/cm2 Pre-ruminal incubation Soak bags in water/buffer prior to incubation Bag insertion and removal Weight bags to position in rumen Insert at specific time intervals and retrieve as group Upon removal, wash bags under cold water Incubation times 0 to 6 h: 3 to 6 time points 6 to 24 h: 3 to 6 time points > 25 h: 6 to 12-h intervals Bag porosity (pore size): is a compromise between allowing influx of microbial populations to degrade the test feed and escape of accumulated gases, while at the same time minimizing the influx of rumen contents not associated with the test feed and the efflux of undegraded feed particles. Sample size to bag surface area: optimum sample size is that which provides enough residue at the end of extended rumen incubation for chemical analysis without over filling the bag so as to delay bacterial attachment, increase lag time, and underestimate digestion rates. 10 to 20 mg/cm2: if using 10 × 15 cm bags then the surface area is equal to 10 × 15 × 2 sides = 300 cm2 , therefore 3 to 6 g of sample are used. Incubation times: bags are incubated and withdrawn at various times so that a description of degradation over time is obtained. The number of time points during the digestion sequence should be adequate to detect an observable lag time (1-h intervals) and an end-point of digestion. For most protein supplements and concentrate ingredients, 48 to 72 h of incubation is adequate to detect a ruminal digestion end-point. For forages, 72 to 108 h of incubation may be required.
: is a compromise between allowing influx of microbial populations to degrade the test feed and escape of accumulated gases, while at the same time minimizing the influx of rumen contents not associated with the test feed and the efflux of undegraded feed particles. Sample size to bag surface area: optimum sample size is that which provides enough residue at the end of extended rumen incubation for chemical analysis without over filling the bag so as to delay bacterial attachment, increase lag time, and underestimate digestion rates. 10 to 20 mg/cm2: if using 10 × 15 cm bags then the surface area is equal to 10 × 15 × 2 sides = 300 cm2 , therefore 3 to 6 g of sample are used. Incubation times: bags are incubated and withdrawn at various times so that a description of degradation over time is obtained. The number of time points during the digestion sequence should be adequate to detect an observable lag time (1-h intervals) and an end-point of digestion. For most protein supplements and concentrate ingredients, 48 to 72 h of incubation is adequate to detect a ruminal digestion end-point. For forages, 72 to 108 h of incubation may be required.")
18
In situ : Dacron bags, 9 * 12 cm (52- mm pore size) were filled with 2 g of ground (2-mm screen) incubated in the ventral rumen of two cows in for 4, 8, 12, 16, 20, 24,36, 48, 72, and 96 h removal from the rumen, bags were immediately soaked in ice water and transferred to a washing machine for rinsing

19
In situ : Zero-hour bags were soaked in tapid water for 30 min and were washed with the other bags to estimate the soluble (degraded) CP fraction (A). Bags were dried for 48 h at 60°C and weighed then placed into a Kjeldahl flask for CP analysis In situ incubations were replicated three times (twice in one cow and once in the other)
 CP fraction (A). Bags were dried for 48 h at 60°C and weighed. then placed into a Kjeldahl flask for CP analysis. In situ incubations were replicated three times (twice in one cow and once in the other)")
20
Recommended guidelines for ruminal in situ degradation procedures
Zero hour bags Incubate in artificial rumen fluid at 39°C for 30 min Animal/period Use type of animal for which the digestion rate determinations are to be applied Replicate Diet Feed ingredients to be tested included in the basal diet Microbial contamination Use of microbial marker to correct for contamination Especially for low quality forages

23
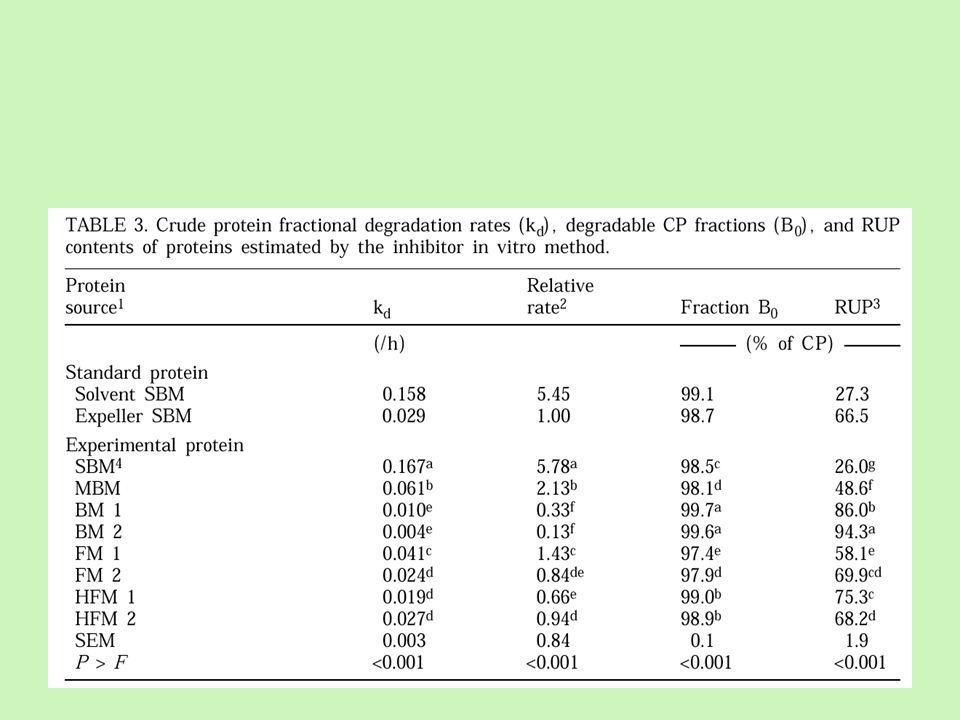
The degredation rate of in vitro method were higher than in situ method
Linear regression indicated that degradation rates estimated by IIV technique were highly correlated with those estimated by the IS method All two procedures ranked the animal by product proteins similarly for degradation rate and ruminal escape Of these two methods, the IIV method was the most rapid and required the least labor

24
Effect of bacterial nitrogen contamination on the percent error associated with determination of residual nitrogen Ruminal incubation time, h Ingredient % error Corn Barley Canola meal Soybean meal Barley straw Alfalfa hay Percentage error = (|corrected N - uncorrected N|/corrected N) 100 Concentrate ingredients generally contain little microbial contamination (5 to 10% of residual N), except for barley which can have quite high microbial contamination at 12 h incubation. Forages with low N content and slow rates of degradability tend to have more contamination of the residue. When forages are corrected for bacterial N contamination they will have reduced digestion, reduced lag times less nondigestible residue, and faster N digestion rates. Low protein forages and coarse feedstuffs should be corrected for microbial contamination.
 100. Concentrate ingredients generally contain little microbial contamination (5 to 10% of residual N), except for barley which can have quite high microbial contamination at 12 h incubation. Forages with low N content and slow rates of degradability tend to have more contamination of the residue. When forages are corrected for bacterial N contamination they will have reduced digestion, reduced lag times less nondigestible residue, and faster N digestion rates. Low protein forages and coarse feedstuffs should be corrected for microbial contamination.")
25
Interpretation of Results from Nylon Bags
100 80 Slowly digestible ‘b’ fraction Rate constant ‘c’ 60 CP Disappearance, % 40 Soluble ‘a’ fraction 20 12 24 36 48 The complete degradation curve is sigmoid in shape. Most of the curve is described by an exponential equation: y = a + b(1-e-c(t-L)), for t > L where: y = CP degradation at time t (%) t = time of incubaton (hours) a = the rapidly soluble fraction (%) b = the fraction that will degraded in the rumen in time, the slowly digestible fraction (%) c = the fractional rate of disappearance; the rate at which fraction b will be degraded per hour (%/h) The sum of fraction a and b is equal to the potentially degradable fraction. It follows, therefore, that (a + b) is the percentage which is totally undegradable in the rumen. Time of incubation, h Degradation is described by an exponential equation: y = a + b(1-e-c(t-L)) for t > L
), for t > L. where: y = CP degradation at time t (%) t = time of incubaton (hours) a = the rapidly soluble fraction (%) b = the fraction that will degraded in the rumen in time, the slowly digestible fraction (%) c = the fractional rate of disappearance; the rate at which fraction b will be degraded per hour (%/h) The sum of fraction a and b is equal to the potentially degradable fraction. It follows, therefore, that (a + b) is the percentage which is totally undegradable in the rumen. Time of incubation, h. Degradation is described by an exponential equation: y = a + b(1-e-c(t-L)) for t > L.")
26
In situ ruminal degradation of crude protein in canola meal (CM), corn gluten meal (CGM) and fishmeal (FM) 100 CM 80 FM 60 CP Disappearance, % 40 CGM 20 12 24 36 48 60 72 Time of incubation, h

27
Effective degradability
Effective degradability (ED) = a + b × c/(c + k) where: a, b and c are constants as defined previously k = fractional outflow rate from the rumen (/h) Typically values for k: 0.02 to 0.10 for protein supplements 0.017 to 0.05 for forages The degradation curves shown on the previous pages were obtained by retaining the samples in the rumen (by containment in a nylon bag). Normally food material can leave the rumen once its particle size has been reduced by degradation and rumination. Many concentrate foods and supplements (eg canola meal, fishmeal) are already of a particle size small enough to leave the rumen without further size reduction. Thus the degradation actually achieved within the rumen, the effective degradation, will depend on how long the food remains within the rumen (i.e., the retention time).
 = a + b × c/(c + k) where: a, b and c are constants as defined previously. k = fractional outflow rate from the rumen (/h) Typically values for k: 0.02 to 0.10 for protein supplements to 0.05 for forages. The degradation curves shown on the previous pages were obtained by retaining the samples in the rumen (by containment in a nylon bag). Normally food material can leave the rumen once its particle size has been reduced by degradation and rumination. Many concentrate foods and supplements (eg canola meal, fishmeal) are already of a particle size small enough to leave the rumen without further size reduction. Thus the degradation actually achieved within the rumen, the effective degradation, will depend on how long the food remains within the rumen (i.e., the retention time).")
28
Effect of ruminal outflow rate on effective degradability of crude protein in canola meal (CM), corn gluten meal (CGM) and fishmeal (FM) 80 CM 60 FM Effective degradability, % 40 CGM 20 .02 .04 .06 .08 .10 Fractional outflow rate, /h

29
Problems with nylon bags
Standardising rumen liquor ?? Micro-environments within bags Particle loss from the bags Contamination of residues with microbial matter

31
Particle loss

32
In vivo determination of protein digestion and microbial protein synthesis
Requires ruminally and abomasally or duodenally (anterior to the pancreatic and bile ducts) cannulated animals. Differentiation between feed protein and microbial protein flowing to the duodenum (use of microbial markers).
 cannulated animals. Differentiation between feed protein and microbial protein flowing to the duodenum (use of microbial markers).")
33
Microbial fraction estimated
Internal and external markers for quantifying microbial protein synthesis in the rumen Microbial fraction estimated Internal 2,6-Diaminopimelic acid (DAPA) Bacteria D-Alanine Bacteria 2-Aminoethylphosphonic acid (AEP) Protozoa Phosphatidyl choline Protozoa ATP Bacteria and protozoa Nucleic acids Bacteria and protozoa DNA RNA Individual purines and pyrimidines Total purines Nucleotide probes Bacteria and protozoa External 15N Bacteria and protozoa 35S Bacteria and protozoa 32P Bacteria and protozoa Microbial markers may be classified as internal markers (inherently present in microorganisms) and external markers (markers added to the rumen to label the microorganisms). DAPA (D-Alanine) - located in cell wall - overestimates bacterial nitrogen flow when lysis of bacterial cells is large. Intraruminal degradation of bacterial protoplasmic proteins is more rapid and extensive than cell-wall residues and their constituent DAP, thus total DAP flowing out of the rumen is disproportionately high AEP - widespread distribution of AEP and other aminophosphonic acids among ruminal bacteria and presence in feedstuffs ATP - rapid hydrolysis of ATP and little or no ATP formation in inactive or dead cells Nucleic acids - DNA and RNA unstable - presence of nucleic acids in feedstuffs but content is low and degradation in rumen is nearly complete - may overestimate microbial N flow with feedstuffs of low rumen degradability, particularly at high ruminal outflow rates 15N - stable isotope - most reliable - introduced into the rumen as 15N-ammonium salts [(15NH4)2SO4, 15NH4Cl] - bacterial N is labelled by direct incorporation of 15N-ammonia 35S and 32P - radioactive isotopes - 35S incorporated into cyst and met and other S-containing compounds - 32P incorporated into phospholipids
 Bacteria. D-Alanine Bacteria. 2-Aminoethylphosphonic acid (AEP) Protozoa. Phosphatidyl choline Protozoa. ATP Bacteria and protozoa Nucleic acids Bacteria and protozoa. DNA. RNA. Individual purines and pyrimidines. Total purines. Nucleotide probes Bacteria and protozoa. External. 15N Bacteria and protozoa. 35S Bacteria and protozoa. 32P Bacteria and protozoa. Microbial markers may be classified as internal markers (inherently present in microorganisms) and external markers (markers added to the rumen to label the microorganisms). DAPA (D-Alanine) - located in cell wall. - overestimates bacterial nitrogen flow when lysis of bacterial cells is large. Intraruminal degradation of bacterial protoplasmic proteins is more rapid and extensive than cell-wall residues and their constituent DAP, thus total DAP flowing out of the rumen is disproportionately high. AEP. - widespread distribution of AEP and other aminophosphonic acids among ruminal bacteria and presence in feedstuffs. ATP. - rapid hydrolysis of ATP and little or no ATP formation in inactive or dead cells. Nucleic acids. - DNA and RNA unstable. - presence of nucleic acids in feedstuffs but content is low and degradation in rumen is nearly complete. - may overestimate microbial N flow with feedstuffs of low rumen degradability, particularly at high ruminal outflow rates. 15N - stable isotope. - most reliable. - introduced into the rumen as 15N-ammonium salts [(15NH4)2SO4, 15NH4Cl] - bacterial N is labelled by direct incorporation of 15N-ammonia. 35S and 32P - radioactive isotopes. - 35S incorporated into cyst and met and other S-containing compounds. - 32P incorporated into phospholipids. ")
34
Microbial markers - cont’d
Purine derivatives microbial nucleic acids are extensively degraded in the intestine yielding purines microbial purines are absorbed and the majority are metabolized by the animal to allantoin, uric acid, xanthine and hypoxanthine (in sheep) and excreted in urine amount of microbial N reaching duodenum is calculated from the excretion of purine derivatives in urine requires total collection of urine
 and excreted in urine. amount of microbial N reaching duodenum is calculated from the excretion of purine derivatives in urine. requires total collection of urine.")
35
Experimental timeline for protein digestibility study
Days 7 14 21 26 Feed intake Dietary adaptation (14 d) Marker administration Microbial (15N) Digestibility (Yb) 0.42 0.41 0.40 0.39 15N enrichment of bacteria, atom % 0.38 0.37 0.36 Duodenal digesta Feces Rumen bacteria 0.35 2 4 6 8 10 12 15N infusion, d
 Marker administration. Microbial (15N) Digestibility (Yb) N enrichment of bacteria, atom % Duodenal digesta. Feces. Rumen bacteria N infusion, d.")
36
Protein digestion and microbial protein synthesis in a lactating dairy cow
Item Value Calculation N intake, g/d 558 DM intake (kg/d) Feed N (g/kg) Duodenal N flow Total N g/d 546 Duod DM flow (kg/d) Duod N (g/kg) Duod DM flow (kg/d)= Intake of digestibility marker (g/d)/ Marker in duod digesta (g/kg) % N intake 97.8 Duod N flow (g/d)/N intake (g/d) 100% NH3-N, g/d 20.4 NAN g/d 526 Total N flow (g/d) - NH3-N flow (g/d) % N intake 94.2 NAN flow (g/d)/N intake (g/d) 100% Microbial N g/d 286 Duod marker flow (g/d)/ (Microbial marker/Microbial N (g/d) ) % of NAN 54.4 Microbial N flow (g/d)/NAN flow (g/d) 100% g/kg RFOM 23.4 Microbial N flow (g/d)/((OM intake (kg) - Duod OM flow(kg) - Microbial OM flow (kg))
 Feed N (g/kg) Duodenal N flow. Total N. g/d 546 Duod DM flow (kg/d) Duod N (g/kg) Duod DM flow (kg/d)= Intake of digestibility marker (g/d)/ Marker in duod digesta (g/kg) % N intake 97.8 Duod N flow (g/d)/N intake (g/d) 100% NH3-N, g/d NAN. g/d 526 Total N flow (g/d) - NH3-N flow (g/d) % N intake 94.2 NAN flow (g/d)/N intake (g/d) 100% Microbial N. g/d 286 Duod marker flow (g/d)/ (Microbial marker/Microbial N (g/d) ) % of NAN 54.4 Microbial N flow (g/d)/NAN flow (g/d) 100% g/kg RFOM 23.4 Microbial N flow (g/d)/((OM intake (kg) - Duod OM. flow(kg) - Microbial OM flow (kg))")
37
Protein digestion and microbial protein synthesis in a lactating dairy cow -cont’d
Item Value Calculation Duodenal N flow Feed N g/d 240 Total N flow (g/d) - Microbial N flow (g/d) - NH3-N flow (g/d) % NAN 45.6 Feed N flow (g/d)/ NAN flow (g/d) 100% % N intake 44 Feed N flow (g/d)/N intake (g/d) 100% Digestibility, % Ruminal Apparent 5.7 (N intake (g/d) - Duod NAN flow (g/d))/ N intake (g/d) 100% Corrected 57 ((N intake (g/d) - (Duod NAN flow (g/d) - Microbial Nflow (g/d)))/N intake (g/d) 100% Post-ruminal 72.2 (Duod NAN flow (g/d) - Fecal N (g/d))/ Duod NAN flow (g/d) 100% Total tract 73.8 (N intake (g/d) - Fecal N (g/d))/N intake (g/d) 100%
 - Microbial N flow (g/d) - NH3-N flow (g/d) % NAN 45.6 Feed N flow (g/d)/ NAN flow (g/d) 100% % N intake 44 Feed N flow (g/d)/N intake (g/d) 100% Digestibility, % Ruminal. Apparent 5.7 (N intake (g/d) - Duod NAN flow (g/d))/ N intake (g/d) 100% Corrected 57 ((N intake (g/d) - (Duod NAN flow (g/d) - Microbial Nflow (g/d)))/N intake (g/d) 100% Post-ruminal 72.2 (Duod NAN flow (g/d) - Fecal N (g/d))/ Duod NAN flow (g/d) 100% Total tract 73.8 (N intake (g/d) - Fecal N (g/d))/N intake (g/d) 100%")
Similar presentations


 What is Dairyman’s Edge ® PRO? 2) How it works 3) Proof it works 4) Economic benefits 5) Summation.>")


 and NRC (2001) Feeding System Muhammad Naveed ul Haque, PhD Assistant.>")
Increase.>")
