Download presentation
Presentation is loading. Please wait.

1
Nitrogen deposition and extinction risk in carnivorous plants: ecological challenges for the next century Nicholas J. Gotelli Department of Biology University of Vermont Burlington, VT 05405 U.S.A.

4
Effects of N Deposition Individual Altered morphology Changes in reproduction, survivorship

5
Effects of N Deposition Individual Altered morphology Changes in reproduction, survivorship Population Increased long-term extinction risk Changes in short-term dynamics

6
Effects of N Deposition Individual Altered morphology Changes in reproduction, survivorship Population Increased long-term extinction risk Changes in short-term dynamics Community Changes in abundance and composition Altered nutrient transfer and storage

7
Effects of N Deposition on Carnivorous Plants Life History Effects on Individuals Effects on Populations Effects on Communities The Role of Ecologists

8
Effects of N Deposition on Carnivorous Plants Life History Effects on Individuals Effects on Populations Effects on Communities The Role of Ecologists

9
Carnivorous plants: well- known, but poorly studied

10
Carnivory in plants Phylogenetically diverse Morphological, chemical adaptations for attracting, capturing, digesting arthropods Common in low N habitats Poor competitors for light, nutrients

11
Family Sarraceniaceae GenusCommon Name Number of Species Distribution DarlingtoniaCobra Lilly1Northwest USA HeliamphoraSun Pitchers5North-central South America SarraceniaPitcher Plants8Eastern USA, Canada

12
Genus Sarracenia 8 described species Center of diversity in southeastern US Many subvarieties Extensive hybridization Sarracenia purpurea (New Jersey- Canada)
")
13
The Northern Pitcher Plant Sarracenia purpurea Perennial plant of low-N peatlands Lifespan 30-50 y Arthropod prey capture in water- filled pitchers Diverse inquiline community in pitchers

16
The Inquilines Wyeomyia smithii Metriocnemus knabiHabrotrocha rosa Blaesoxipha fletcheri Sarraceniopus gibsoni

17
Inquiline food web

18
Phyllodia Flat leaves No prey capture High concentration of chlorophyll, stomates Photosynthetically more efficient than pitchers

19
Flowering Stalks Single stalk per rosette Flowering after 3 to 5 years Bumblebee, fly pollinated Short-distance dispersal of seeds

20
Leaf Senescence End-of-season die off Production of new leaves in following spring Annual increase in rosette diameter

21
Effects of N Deposition on Carnivorous Plants Life History Effects on Individuals Effects on Populations Effects on Communities The Role of Ecologists

22
Nutrient Treatments Distilled H 2 0 Micronutrients Low N (0.1 mg/L) High N (1.0 mg/L) Low P (0.025 mg/L) High P (0.25 mg/L) N:P(1) Low N + Low P N:P(2) Low N + High P N:P(3) High N + Low P Nutrient Source: Micronutrients: Hoaglands N: NH 4 Cl P: NaH 2 PO 4
 High N (1.0 mg/L) Low P (0.025 mg/L) High P (0.25 mg/L) N:P(1) Low N + Low P N:P(2) Low N + High P N:P(3) High N + Low P Nutrient Source: Micronutrients: Hoaglands N: NH 4 Cl P: NaH 2 PO 4")
23
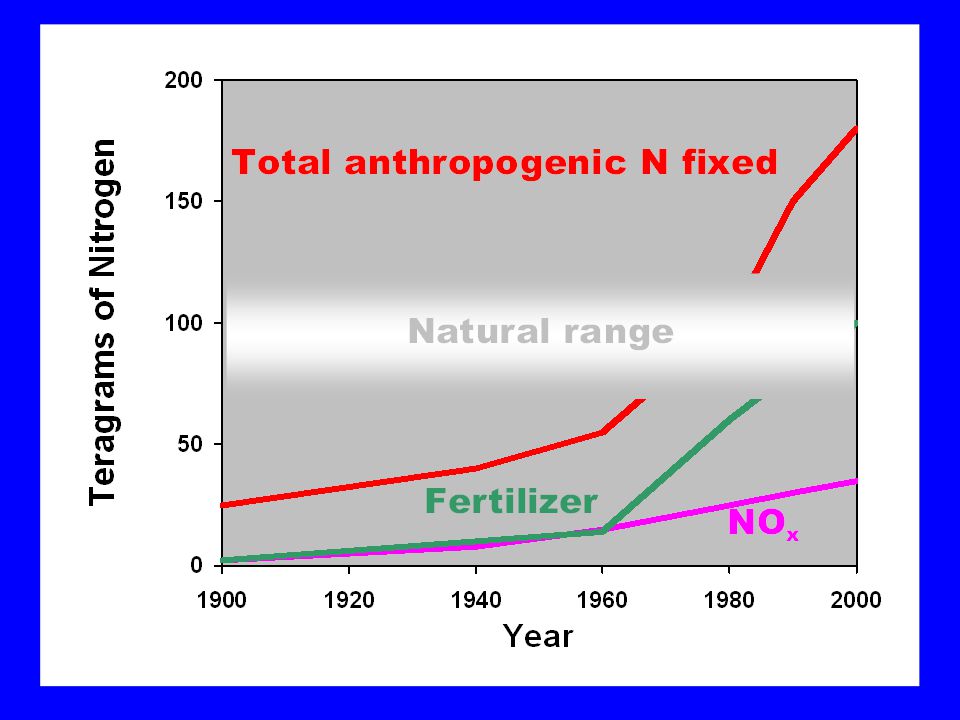
Anthropogenic N additions alter growth and morphology

25
Increasing N

26
Effects of Anthropogenic N additions Increased production of phyllodia Phenotypic shift from carnivory to photosynthesis Increased probability of flowering

27
Contrasting effects of anthropogenic N vs. N derived from prey

28
Food Addition Experiment Ecological “press” experiment Food supplemented with house flies Treatments: 0, 2, 4,6, 8,10,12, 14 flies/week Plants harvested after one field season

29
Food additions do not alter growth and morphology Increasing prey

30
N uptake increases with food level

31
P uptake increases with food level

32
N:P ratio decreases with increasing food supply

33
Altered N:P ratios suggest P limitation under ambient conditions P limitation (Koerselman & Meuleman 1996, Olde Venternik et al. in press) Ambient
 Ambient.")
34
Food additions do not alter growth and morphology Increasing prey

35
Anthropogenic N additions alter growth and morphology Increasing N

36
Contrasting effects of anthropogenic and natural sources of N Anthropogenic N Altered N:P ratios Morphological shift Reduction in prey uptake Prey N Uptake, storage of N & P No morphological shifts Continued prey uptake

37
Effects of N Deposition on Carnivorous Plants Life History Effects on Individuals Effects on Populations Effects on Communities The Role of Ecologists

40
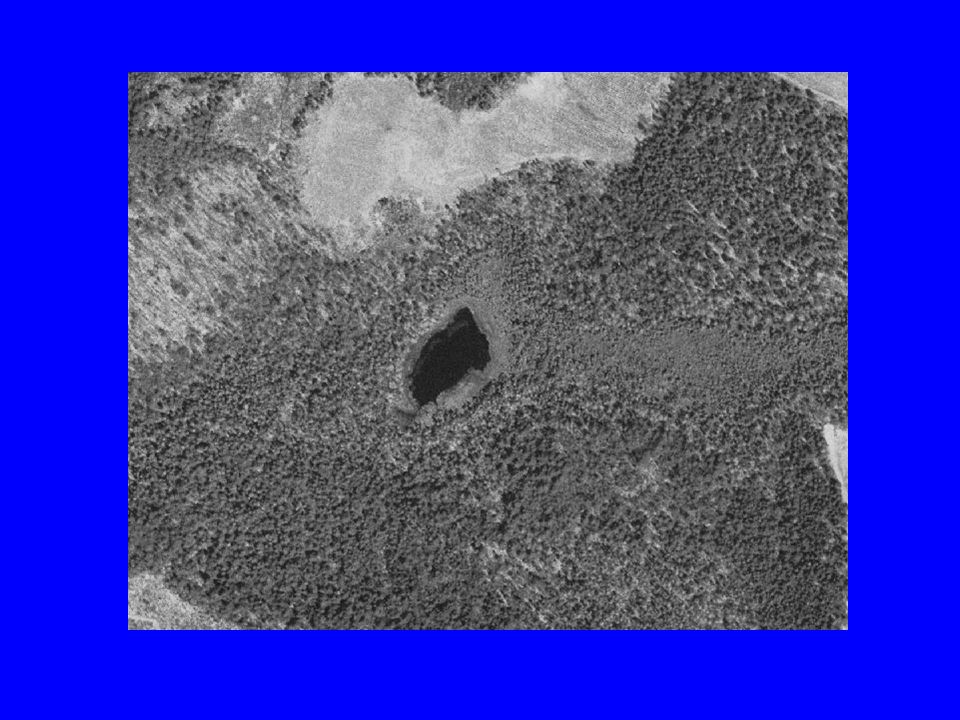
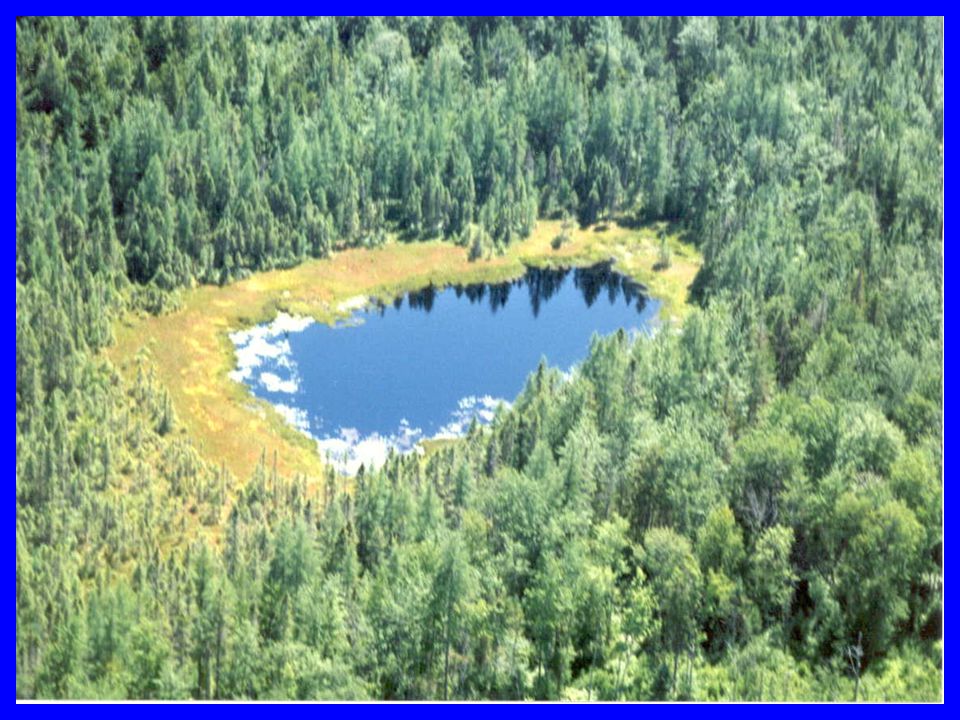
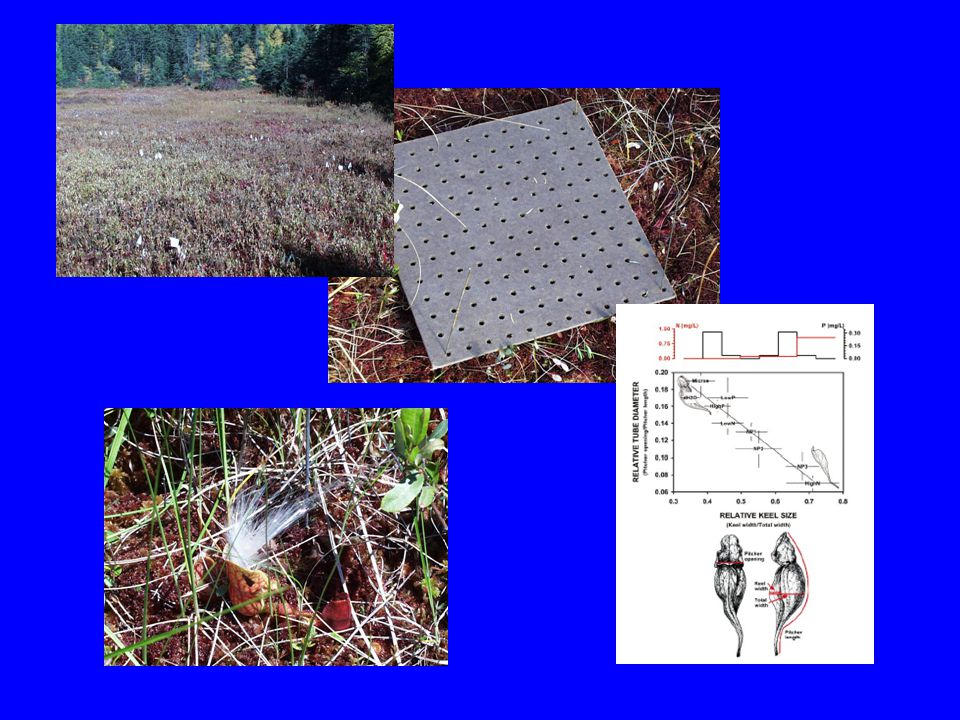
Study Sites

44
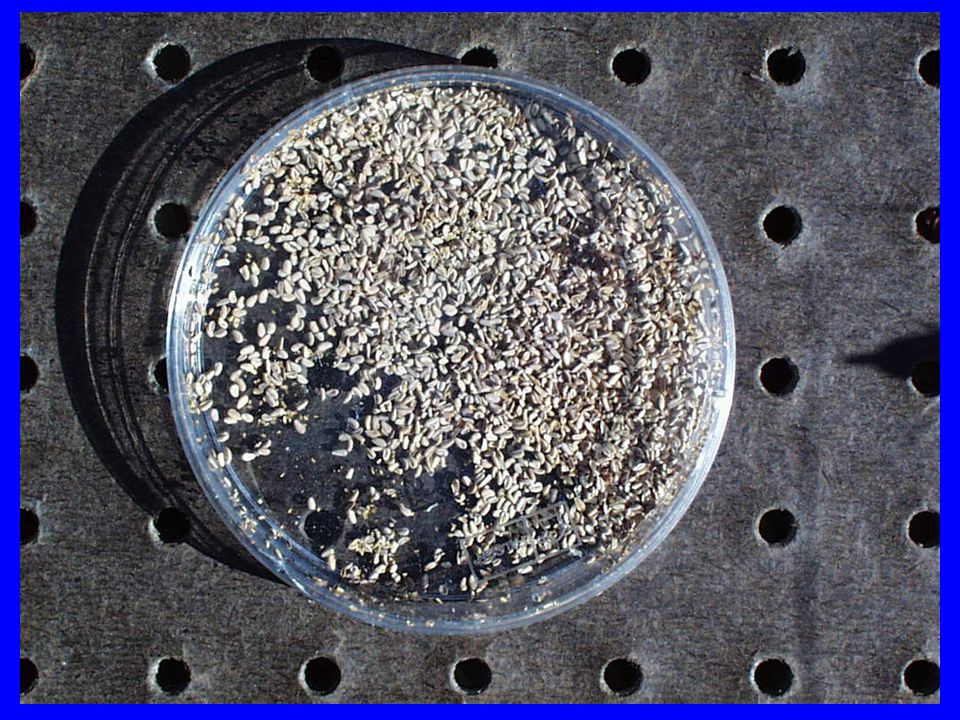
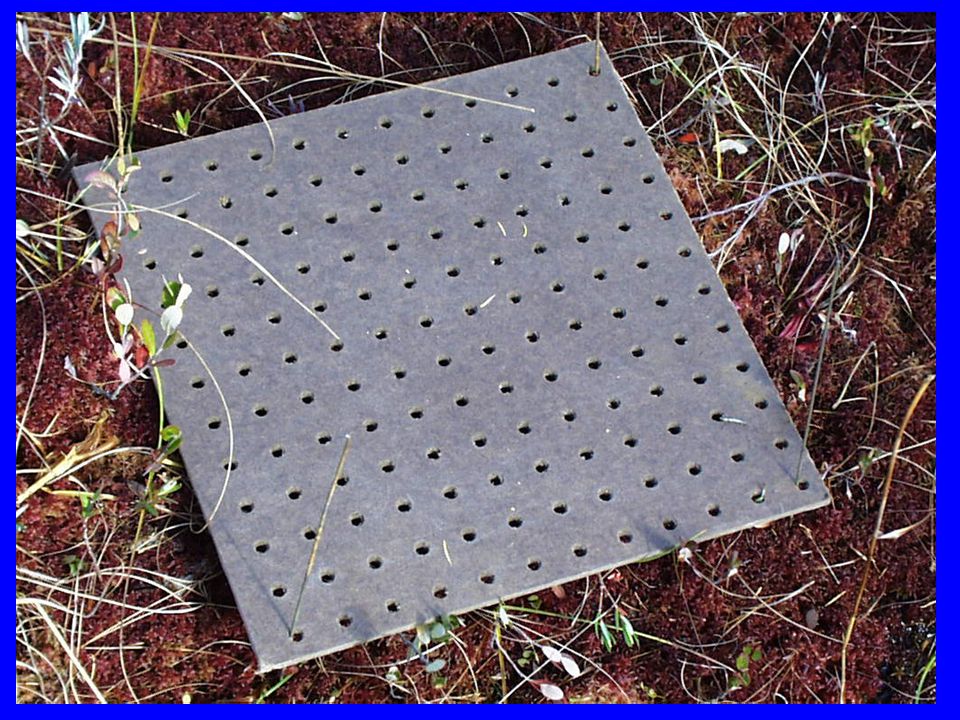
Demography survey 100 adult, juvenile plants tagged at each site Plants censused and measured each year Seed plantings to estimate recruitment functions

48
Recruits Juveniles Adults Flowering Adults Sarracenia matrix model

49
Recruits Juveniles Adults Flowering Adults Hawley Bog Transitions 0.10 4.00 0.04 0.09 0.18 0.83 0.950.70 0.17

50
Recruits Juveniles Adults Flowering Adults Molly Bog Transitions 0.10 4.00 0.13 0.17 0.10 0.66 0.850.71 0.31

51
Matrix Transition Model (stationary) n t+1 = An t Population vector at time (t + 1) Transition matrix Population vector at time (t)
 n t+1 = An t Population vector at time (t + 1) Transition matrix Population vector at time (t)")
52
Population Projections Siter individuals/individualyear Doubling Time Hawley Bog0.00456152 y Molly Bog0.00554125 y

53
Deterministic Model: Results Growth, survivorship, and reproduction are closely balanced in both sites Doubling times > 100 y Juvenile, adult persistence contribute most to population growth rate Sexual reproduction, recruitment relatively unimportant

54
Matrix Transition Model (stochastic) n t+1 = A t n t Population vector at time (t + 1) Random transition matrix at time (t) Population vector at time (t)
 n t+1 = A t n t Population vector at time (t + 1) Random transition matrix at time (t) Population vector at time (t)")
57
Stochastic Model: Results Cannot reject H 0 (r = 0.0) Environmental variation can lead to a substantial risk of long-term extinction (0.3 < p(ext) < 0.6)
 Environmental variation can lead to a substantial risk of long-term extinction (0.3 < p(ext) < 0.6)")
58
How do N and P concentrations affect population growth of Sarracenia?

60
Nutrient Addition Experiment 10 juveniles, 10 adults/treatment Nutrients added to leaves twice/month Nutrient concentrations bracket observed field values Nutrient treatments maintained 1998, 1999 “Press” experiment

62
Nutrient Treatments Distilled H 2 0 Micronutrients Low N (0.1 mg/L) High N (1.0 mg/L) Low P (0.025 mg/L) High P (0.25 mg/L) N:P(1) Low N + Low P N:P(2) Low N + High P N:P(3) High N + Low P Nutrient Source: Micronutrients: Hoaglands N: NH 4 Cl P: NaH 2 PO 4
 High N (1.0 mg/L) Low P (0.025 mg/L) High P (0.25 mg/L) N:P(1) Low N + Low P N:P(2) Low N + High P N:P(3) High N + Low P Nutrient Source: Micronutrients: Hoaglands N: NH 4 Cl P: NaH 2 PO 4")
63
Effects of N additions Increased production of phyllodia Increased probability of flowering

64
Effects of N additions Increased production of phyllodia Increased probability of flowering Decreased juvenile survivorship

65
L L M H H

66
H M L H L

67
Effects of Nitrogen on Demography: Results Population growth rates respond to different N and P regimes Population growth rate decreases in response to increasing N Population growth rate decreases in responses to increasing N:P

68
Modeling Long-term Environmental Change Observed N Deposition Long-term Forecast N(t) Transition Matrix (t) Population Structure (t) Time Series Modeling Transition Function Population Time Series Extinction Risk Time to Extinction Matrix Multiplication
 Transition Matrix (t) Population Structure (t) Time Series Modeling Transition Function Population Time Series Extinction Risk Time to Extinction Matrix Multiplication")
69
Modeling Long-term Environmental Change Observed N Deposition Long-term Forecast N(t) Transition Matrix (t) Population Structure (t) Time Series Modeling Transition Function Population Time Series Extinction Risk Time to Extinction Matrix Multiplication
 Transition Matrix (t) Population Structure (t) Time Series Modeling Transition Function Population Time Series Extinction Risk Time to Extinction Matrix Multiplication")
70
N monitoring National Atmospheric Deposition Program NH 4, NO 3 measured as mg/l/yr Annual data 1984-1998 Monitoring sites Shelburne, VT Quabbin, MA

71
Quabbin, MA Shelburne, VT NH 4 N0 3

72
Quabbin, MA Shelburne, VT NH 4 N0 3

73
Regression Models Ordinary Least Squares (OLS) N t = a + bt + e First-order auto- regressive (AR-1) N t = a +bN t-1 + e
 N t = a + bt + e First-order auto- regressive (AR-1) N t = a +bN t-1 + e")
75
Modeling Long-term Environmental Change Observed N Deposition Long-term Forecast N(t) Transition Matrix (t) Population Structure (t) Time Series Modeling Transition Function Population Time Series Extinction Risk Time to Extinction Matrix Multiplication
 Transition Matrix (t) Population Structure (t) Time Series Modeling Transition Function Population Time Series Extinction Risk Time to Extinction Matrix Multiplication")
76
Establishing Transition Functions Linear interpolation between observed data points (n = 3) Asymptotic transitions at extreme levels of nitrogen: p ij = observed p ij if [N] < 0.01 mg/l/yr p ij = 0.0 if [N] > 10.0 mg/l/yr Logarithmic response curve
![Establishing Transition Functions Linear interpolation between observed data points (n = 3) Asymptotic transitions at extreme levels of nitrogen: p ij = observed p ij if [N] < 0.01 mg/l/yr p ij = 0.0 if [N] > 10.0 mg/l/yr Logarithmic response curve](http://images.slideplayer.com/13/4019596/slides/slide_76.jpg "Establishing Transition Functions Linear interpolation between observed data points (n = 3) Asymptotic transitions at extreme levels of nitrogen: p ij = observed p ij if [N] < 0.01 mg/l/yr p ij = 0.0 if [N] > 10.0 mg/l/yr Logarithmic response curve")
77
Modeling Demographic Transitions as a Function of Nitrogen

78
Modeling Long-term Environmental Change Observed N Deposition Long-term Forecast N(t) Transition Matrix (t) Population Structure (t) Time Series Modeling Transition Function Population Time Series Extinction Risk Time to Extinction Matrix Multiplication
 Transition Matrix (t) Population Structure (t) Time Series Modeling Transition Function Population Time Series Extinction Risk Time to Extinction Matrix Multiplication")
79
Matrix Transition Model (changing environment) n t+1 = A t n t Population vector at time (t + 1) Sequentially changing transition matrix at time (t) Population vector at time (t)
 n t+1 = A t n t Population vector at time (t + 1) Sequentially changing transition matrix at time (t) Population vector at time (t)")
80
Estimated population size at Hawley bog StageNumber of individuals Recruits1500 Juveniles23,500 Non-flowering Adults1400 Flowering Adults500

81
Quabbin Exponential Forecast Models (AR-1) ScenarioAnnual % Change P (ext) at 100 y Time to ext (p = 0.95) Best case-4.7%0.00> 10,000 y No change0.0%0.038650 y Small increase 1%0.378290 y Worst case4.7%0.99670 y
 ScenarioAnnual % Change P (ext) at 100 y Time to ext (p = 0.95) Best case-4.7%0.00> 10,000 y No change0.0% y Small increase 1% y Worst case4.7% y")
82
Shelburne Exponential Forecast Models (AR-1) ScenarioAnnual % Change P (ext) at 100 y Time to ext (p = 0.95) Best case-2.2%0.158> 10,000 y No change0.0%0.510230 y Small increase 1.0%0.694200 y Worst case2.2%0.838140 y
 ScenarioAnnual % Change P (ext) at 100 y Time to ext (p = 0.95) Best case-2.2%0.158> 10,000 y No change0.0% y Small increase 1.0% y Worst case2.2% y")
83
Shelburne Nitrogen Forecast Model

84
Forecasting Models for Nitrogen Deposition: Results Increasing or stationary models of Nitrogen deposition drive Sarracenia populations to extinction Extinction risk declines with reduced nitrogen Correlated nitrogen series can induce cycles and complex population dynamics

85
Effects of N Deposition on Carnivorous Plants Life History Effects on Individuals Effects on Populations Effects on Communities The Role of Ecologists

86
Sarracenia Nutrient Feedback Loop Pitcher Nutrient Pool [N,P] Inquiline Community Arthropod Prey Plant Growth Atmospheric Deposition
![Sarracenia Nutrient Feedback Loop Pitcher Nutrient Pool [N,P] Inquiline Community Arthropod Prey Plant Growth Atmospheric Deposition](http://images.slideplayer.com/13/4019596/slides/slide_86.jpg "Sarracenia Nutrient Feedback Loop Pitcher Nutrient Pool [N,P] Inquiline Community Arthropod Prey Plant Growth Atmospheric Deposition")
87
Sarracenia Nutrient Feedback Loop Pitcher Nutrient Pool [N,P] Inquiline Community Arthropod Prey Plant Growth Atmospheric Deposition
![Sarracenia Nutrient Feedback Loop Pitcher Nutrient Pool [N,P] Inquiline Community Arthropod Prey Plant Growth Atmospheric Deposition](http://images.slideplayer.com/13/4019596/slides/slide_87.jpg "Sarracenia Nutrient Feedback Loop Pitcher Nutrient Pool [N,P] Inquiline Community Arthropod Prey Plant Growth Atmospheric Deposition")
88
Sarracenia Nutrient Feedback Loop Pitcher Nutrient Pool [N,P] Inquiline Community Arthropod Prey Plant Growth Atmospheric Deposition
![Sarracenia Nutrient Feedback Loop Pitcher Nutrient Pool [N,P] Inquiline Community Arthropod Prey Plant Growth Atmospheric Deposition](http://images.slideplayer.com/13/4019596/slides/slide_88.jpg "Sarracenia Nutrient Feedback Loop Pitcher Nutrient Pool [N,P] Inquiline Community Arthropod Prey Plant Growth Atmospheric Deposition")
89
Sarracenia Nutrient Feedback Loop Pitcher Nutrient Pool [N,P] Inquiline Community Arthropod Prey Plant Growth Atmospheric Deposition
![Sarracenia Nutrient Feedback Loop Pitcher Nutrient Pool [N,P] Inquiline Community Arthropod Prey Plant Growth Atmospheric Deposition](http://images.slideplayer.com/13/4019596/slides/slide_89.jpg "Sarracenia Nutrient Feedback Loop Pitcher Nutrient Pool [N,P] Inquiline Community Arthropod Prey Plant Growth Atmospheric Deposition")
90
Nutrients → Inquilines Manipulate [N], [P] in leaves Orthogonal “regression” design Maintain [] in a “press” experiment
![Nutrients → Inquilines Manipulate [N], [P] in leaves Orthogonal regression design Maintain [] in a press experiment](http://images.slideplayer.com/13/4019596/slides/slide_90.jpg "Nutrients → Inquilines Manipulate [N], [P] in leaves Orthogonal regression design Maintain [] in a press experiment")
91
Response Surface Experimenal Design

92
Effects of [N,P] on Inquiline Abundance
![Effects of [N,P] on Inquiline Abundance](http://images.slideplayer.com/13/4019596/slides/slide_92.jpg "Effects of [N,P] on Inquiline Abundance")
93
Sarracenia Nutrient Feedback Loop Pitcher Nutrient Pool [N,P] Inquiline Community Arthropod Prey Plant Growth Atmospheric Deposition
![Sarracenia Nutrient Feedback Loop Pitcher Nutrient Pool [N,P] Inquiline Community Arthropod Prey Plant Growth Atmospheric Deposition](http://images.slideplayer.com/13/4019596/slides/slide_93.jpg "Sarracenia Nutrient Feedback Loop Pitcher Nutrient Pool [N,P] Inquiline Community Arthropod Prey Plant Growth Atmospheric Deposition")
94
Inquilines → Nutrients Manipulate [N], [P] in leaves Orthogonal “regression” design Establish initial [] in a “pulse” experiment
![Inquilines → Nutrients Manipulate [N], [P] in leaves Orthogonal regression design Establish initial [] in a pulse experiment](http://images.slideplayer.com/13/4019596/slides/slide_94.jpg "Inquilines → Nutrients Manipulate [N], [P] in leaves Orthogonal regression design Establish initial [] in a pulse experiment")
95
Response Surface Experimenal Design

96
Null Hypothesis

97
Community Regulation of Nutrients

99
Sarracenia Nutrient Feedback Loop Pitcher Nutrient Pool [N,P] Inquiline Community Arthropod Prey Plant Growth Atmospheric Deposition
![Sarracenia Nutrient Feedback Loop Pitcher Nutrient Pool [N,P] Inquiline Community Arthropod Prey Plant Growth Atmospheric Deposition](http://images.slideplayer.com/13/4019596/slides/slide_99.jpg "Sarracenia Nutrient Feedback Loop Pitcher Nutrient Pool [N,P] Inquiline Community Arthropod Prey Plant Growth Atmospheric Deposition")
100
Nutrients ↔ Inquilines

103
Effects of N Deposition on Carnivorous Plants Life History Effects on Individuals Effects on Populations Effects on Communities The Role of Ecologists

105
Ecology ≠ Environmental Science

106
Reasons for Studying Ecology

107
Natural History

109
Reasons for Studying Ecology Natural History Field Studies & Experiments

111
Reasons for Studying Ecology Natural History Field Studies & Experiments Statistics & Data Analysis

113
Reasons for Studying Ecology Natural History Field Studies & Experiments Statistics & Data Analysis Modeling

114
Pitcher Nutrient Pool [N,P] Inquiline Community Arthropod Prey Plant Growth Atmospheric Deposition
![Pitcher Nutrient Pool [N,P] Inquiline Community Arthropod Prey Plant Growth Atmospheric Deposition](http://images.slideplayer.com/13/4019596/slides/slide_114.jpg "Pitcher Nutrient Pool [N,P] Inquiline Community Arthropod Prey Plant Growth Atmospheric Deposition")
115
Reasons for Studying Ecology Natural History Field Studies & Experiments Statistics & Data Analysis Modeling Collaboration

116
Aaron M. Ellison Harvard Forest

117
Conclusions Anthropogenic deposition of N is a major ecological challenge

118
Conclusions Anthropogenic deposition of N is a major ecological challenge Carnivorous plants in ombrotrophic bogs are a model system

119
Conclusions Anthropogenic deposition of N is a major ecological challenge Carnivorous plants in ombrotrophic bogs are a model system Individual response plants alter morphology and growth in response to N:P ratios

120
Conclusions Anthropogenic deposition of N is a major ecological challenge Carnivorous plants in ombrotrophic bogs are a model system Individual response plants alter morphology and growth in response to N:P ratios Population response N and P environments affect population growth rate

121
Conclusions Anthropogenic deposition of N is a major ecological challenge Carnivorous plants in ombrotrophic bogs are a model system Individual response plants alter morphology and growth in response to N:P ratios Population response N and P environments affect population growth rate Community response Further study of nutrient ↔ inquiline feedback loop

Similar presentations


 Report to NSF September 2005.>")


 and Norway spruce (Picea abies (L.) Karsten) were exposed for three growing.>")

 Ecologists define a population as a single- species group of individuals that use common.>")
