Download presentation
Presentation is loading. Please wait.

1
Where does corn fit into my forage production system? Jean Brisson. agr. R&D Valacta

2
Outline 1.Introduction 2.Interesting to grow corn? 3.Corn feeds 1.Corn silage 2.Earlage/Snaplage 3.Corn grain 4.Conclusions

3
INTRODUCTION

4
Corn market

5
Soybean meal market

6
Source: http://www.fpccq.qc.ca/Files/prix_Cr_grains.pdf Lower price in fall?

7
Quebec corn market (2009 to 2013) Source: http://www.fpccq.qc.ca/Files/prix_Cr_grains.pdf
 Source:")
8
Do you know your feed cost? Do you know your concentrate cost? – $/hl – $/kg quota – $/ton Do you know your milk to concentrate ratio? Do you know your cost of production of forage? Feed cost

9
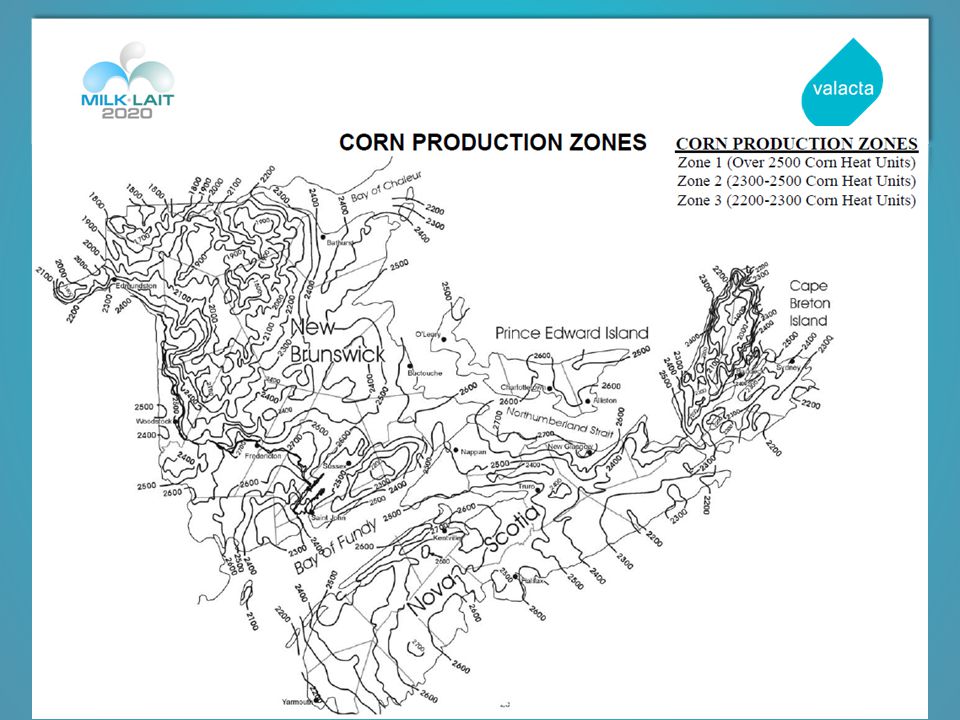
Corn is demanding – Heat – Water – Competition – Soil pH – Nutrients If you don’t do everything right, it shows from the road… To grow corn

10
It is possible to grow corn where it was not possible 25-30 years ago – Climate change – Corn genetic To grow corn

15
Yield is so important! – Ton per hectare Quality is so important! – ADF is key item to watch To grow corn

16
Do you measure yield on your farm? Pretty easy to figure out – Silage box holds 16 feet :1.7 ton dry matter 18 feet: 2.0 tons 24 feet: 2.6 tons To grow corn

17
Corn silage yield varies a lot

18
Corn feeds Corn grower can: Corn silage –Cut high or low Snaplage/Earlage Corn grain –High moisture –Dry

19
Part Average (D.M.) Grain 20-50% Stalk 17-40% Leaves 15-25% Cob 6-10% Part Average (D.M.) Grain 20-50% Stalk 17-40% Leaves 15-25% Cob 6-10% Corn plant composition
 Grain 20-50% Stalk 17-40% Leaves 15-25% Cob 6-10% Part Average (D.M.) Grain 20-50% Stalk 17-40% Leaves 15-25% Cob 6-10% Corn plant composition")
20
Corn silage plant composition Part of the plant % of whole plant % NDF Digest. NDF (%) Digest. dry matter (%) Tassel< 178.453.463.5 Leave node6.178.160.369.0 Ear leave5.880.569.575.4 Leaves8.566.773.282.1 Ear12.189.331.939.2 Stalk18.366.561.574.4 Grain48.511.889.790.0 Mike Allen. 1995
 Digest. dry matter (%) Tassel< Leave node Ear leave Leaves Ear Stalk Grain Mike Allen")
21
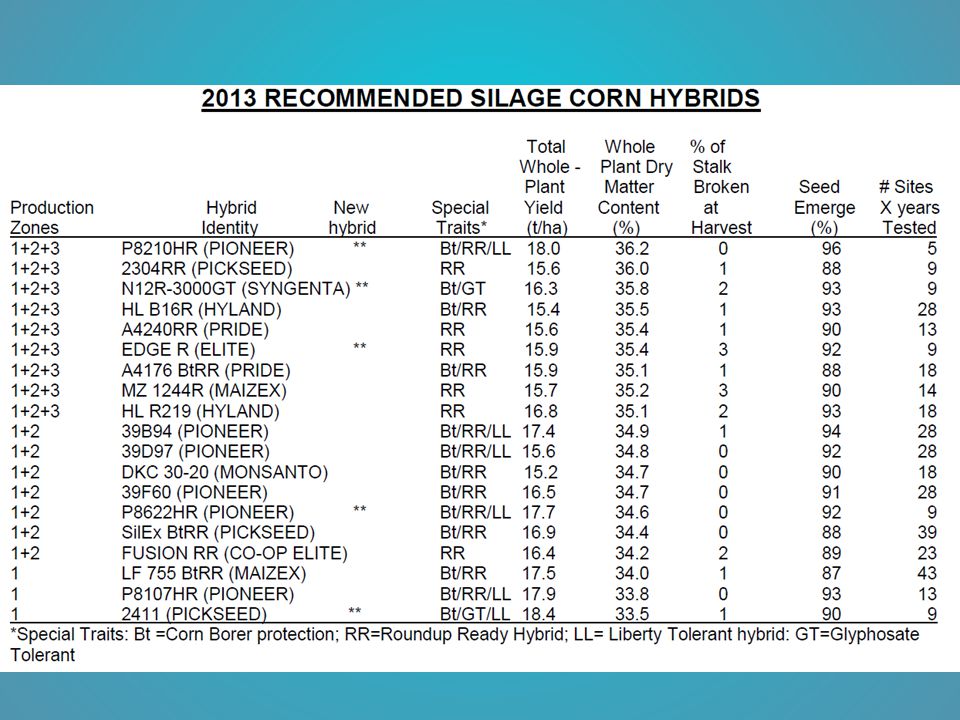
Corn silage may fit Potentially high yield crop – According to La Financière Agricole: 4.8 to 16.6 t. dry matter /ha as compared with grass (1.6 to 6.7t./ha) Usually palatable feed Conservation is good most of the time Potentially high energy forage Harvesting is easier than grass silage Can be harvested 24 hours per day if needed Requires a lot of Nitrogen (manure user)
 Usually palatable feed Conservation is good most of the time Potentially high energy forage Harvesting is easier than grass silage Can be harvested 24 hours per day if needed Requires a lot of Nitrogen (manure user).")
22
Corn silage has its limitation Low protein Low mineral Require more storage capacity

23
Corn silage isn’t a magic feed Decades ago, corn silage has been blamed for health problem like: – Fat cow syndrome – Ketosis – DA’s – Low production Corn silage based ration along with average quality grass silage requires quite a bit of protein supplementation to cover the needs Ration has to be well balanced to deliver good performances

24
Forage base program in Valacta herds (2012)
")
25
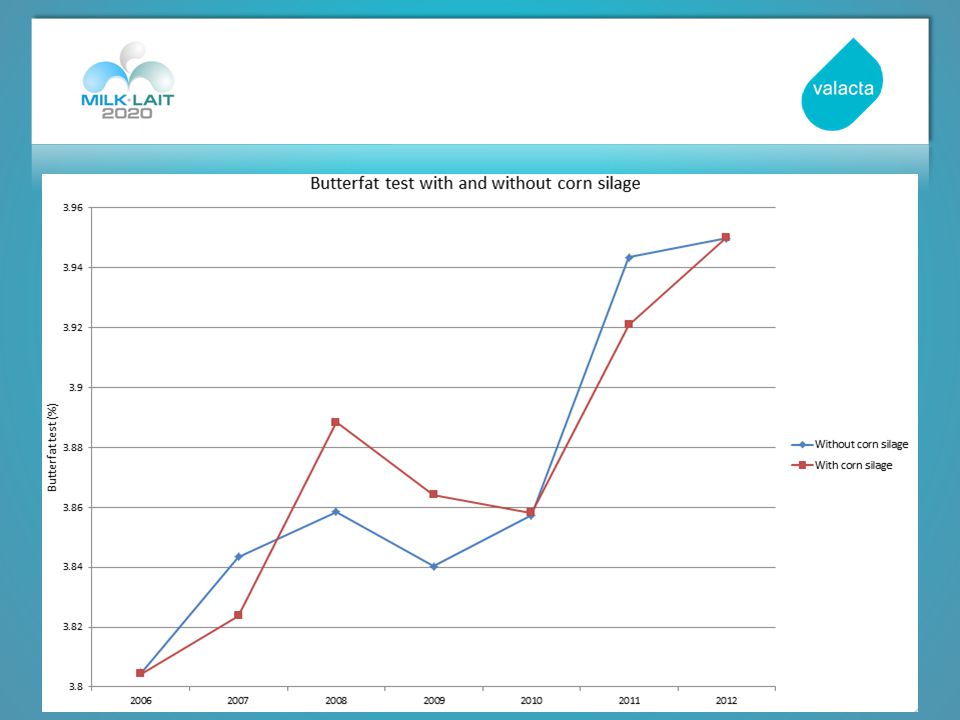
Without corn silageWith corn silage Number of herds14281147 Number of cows4463 Production Milk (kg/cow/yr)82588832 Butterfat (%)3.813.84 Protein (%)3.213.25 SCC('000 cell/ml)247264 Reproduction Calving interval425427 Breeding per cow2.182.25 Feed cost Forage & conc. ($/hl)17.9516.87 Conc. ($/hl)10.5210.20 Herd performance with and without corn silage Source : Valacta. August 2008
 Conc. ($/hl) Herd performance with and without corn silage Source : Valacta. August")
26
MORE MILK WITH CORN SILAGE

27
More milk with corn silage but not always!

29
CORN SILAGE

30
Feed cost with and without corn silage depends on corn and soybean meal market - 71 $+ 37 $ - 48 $ - 70 $

31
Only good corn silage will deliver good performances What are the features of good corn silage?

32
Composition varies quite a bit Source: Valacta lab

33
Composition varies quite a bit Source: Valacta lab

34
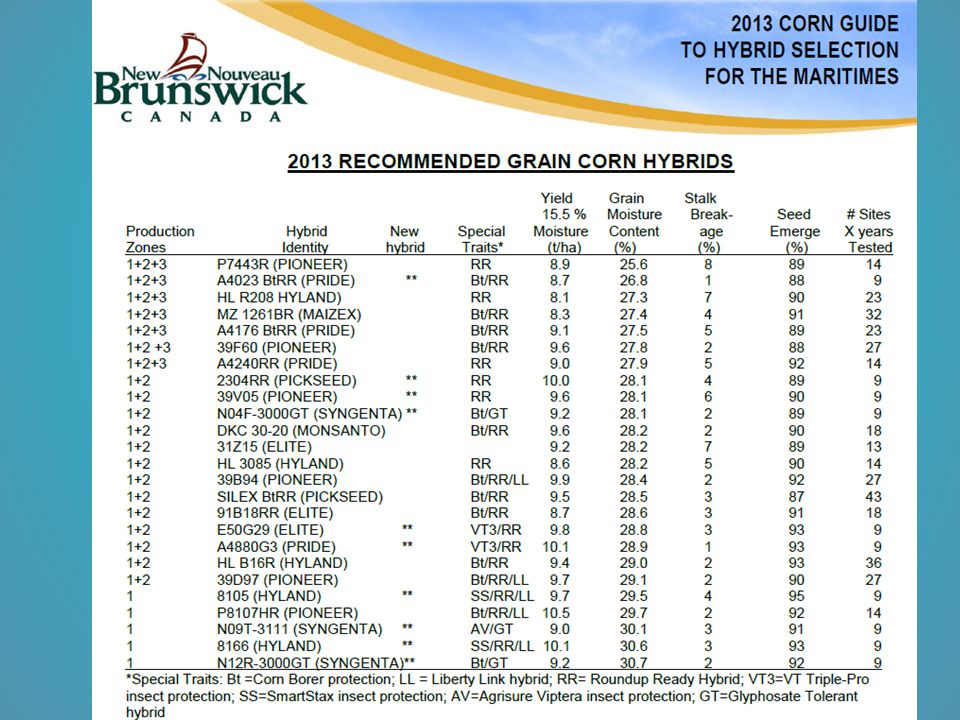
HybridYield (t. d.m./ha) NDFd (%) Starch (%) Milk (kg/ton) Milk (kg/ha) A21.359231 62534 508 B20.861371 68035 180 C21.156341 59533 948 D14.868311 86027 449 E21.765341 78038 653 F22.662351 74039 662 G24.062271 69040 446 Average19.961331 80035 852 Pick the right hybrid for your needs Source: Rankin. M., University of Wisconsin
 NDFd (%) Starch (%) Milk (kg/ton) Milk (kg/ha) A B C D E F G Average Pick the right hybrid for your needs Source: Rankin. M., University of Wisconsin.")
35
Harvested at the right moisture < 28 %28 – 32 %32 – 36 %36 – 40 %> 40 % Number of trials519353016 Dry matter intake (kg/d)24.223.624.123.824.1 Production (kg/d)36.137.336.436.234.5 4% Fat corrected milk (kg/d)33.534.733.533.031.0 Butterfat (%)3.583.593.513.453.42 Protein (%)3.053.073.113.10 Total tract starch digestibility (%) 93.294.092.193.491.3 Source: Shaver, Tri-State Nutrition Conference, 2012
 Production (kg/d) % Fat corrected milk (kg/d) Butterfat (%) Protein (%) Total tract starch digestibility (%) Source: Shaver, Tri-State Nutrition Conference, 2012")
36
Harvest at the right stage Source: Leduc, Pioneer, 2009 Relationship between grain maturity and whole plant moisture (1990 - 1999)
")
37
Kernel processor 1 – 3 mm4 – 8 mm Number of trials437 Dry matter intake (kg/day)23.923.3 Production (kg/day)36.634.6 4% fat corrected milk (kg/day)33.231.5 Butterfat ( % )3.443.42 Protein ( % )3.103.05 Starch digestibility ( % )94.888.9 Source: Shaver, Tri-State Nutrition Conference, 2012
 Production (kg/day) % fat corrected milk (kg/day) Butterfat ( % ) Protein ( % ) Starch digestibility ( % ) Source: Shaver, Tri-State Nutrition Conference, 2012")
38
Source: Kung. 2004 Kernel processor

39
Source: Kung. 2004 Kernel processor

40
Corn silage aerobic stability at feedout Ask Robert, he is the expert

41
Corn silage starch digestibility increases over time of storage Source: Mahanna. 2009

42
Corn products Snaplage/Earlage Corn grain

43
Corn producer

44
Corn products

45
Starch site of digestion Starch may be digested : – In the rumen (80 % efficiency) – In the small intestine (97 % efficiency) – In the large intestine(44 % efficiency) What is the best ? – There is a limited potential for digestion in small intestine – Starch digestion is pretty limited in large intestine… Source : Beauchemin, 2006

46
Corn presentation effect on starch digestibility Source : Firkins. 2001 Corn product Rumen starch digestibility Total tract starch digestibility Craked corn4585 Ground corn5291 Flaked corn5794 High moisture rolled corn8794

47
Equipment Volume (t) Cost ($) Shrinkage and fermentation loss (%) Cost ($/ton fed) Dry grain bin10015 375316.00 Air tight silo and unloader 222 52 350632.00 Roller mill/ Hammer mill 100 4 5000.59.33 Storage and processing cost Source: Dry grain. agdex 732/821b. juillet 2007. Référence Économiques. CRAAQ High-moisture grain. agdex 732/821F. juillet 2007. Référence Économiques. CRAAQ Grain bin. agdex 732/110. janvier 2007. Référence Économiques. CRAAQ

48
Interest cost on inventories FeedVolume Average cost ($/ton) Usage (t/week) Short term interest ($/ t.) Corn1502003.06.73 Corn102503.00.56 Protein supplément 16400.750.57 Protein supplément 56300.752.83
 Usage (t/week) Short term interest ($/ t.) Corn Corn Protein supplément Protein supplément")
49
Where does corn fit? Thank you!

Similar presentations