Download presentation
Presentation is loading. Please wait.

1
North Carolina Northeast State of the Region February 25, 2011

2
Agenda Iberdrola Renewables overview Introduction to wind energy Economic impacts Questions 2

3
The World Leader in Wind Energy #1 in the world for installed renewables; >12,500 MW #2 in the United States; > 4,600 MW 1,043 MW installed in the 2010 41 operating wind projects in 17 states Committed to invest $6B in the US over 2010-2012 3

4
North American Wind Assets Pleasant Valley 144 MW PPA Twin Buttes 75 MW Owned High Winds 162 MW PPA Shiloh 150 MW Owned Mountain View III 25 MW Owned Dillon 45 MW Owned MID-CONTINENT REGION Elk River 150 MW Owned WESTERN REGION Locust Ridge 26MW Owned Locust Ridge II 102MW Owned Casselman 35 MW Owned Maple Ridge II 45 MW Owned (91 MW Project) EASTERN REGION Current as of May 1, 2010 Colorado Green 81 MW Owned (162 MW Project) Lempster 24 MW Owned Maple Ridge 1 116 MW Owned (231 MW Project) Peñascal 202 MW Owned 146 MW Owned Barton Chapel 120 MW Owned Farmers City Dry Lake 63 MW Owned Providence Heights 72 MW Owned Streator Cayuga Ridge 300 MW owned Rugby 149.1 MW owned 1 - Buffalo Ridge 50.4 MW owned 2 - MinnDakota 150 MW owned 3 - Moraine 51 MW owned 4 - Moraine II 49.5 MW owned 5 - Trimont 101 MW owned 6 - Elm Creek 99 MW owned 7 - Flying Cloud 43.5 MW owned 8 - Winnebago 20 MW owned 9 - Top of Iowa II 80 MW owned 10 - Barton 160 MW owned 1 - Klondike III a 76.5 MW owned 2 - Hay Canyon 100.8 MW owned 3 - Klondike 24 MW owned 4 - Klondike III 223.6 MW owned 5 - Star Point 99 MW owned 6 - Klondike II 75 MW owned 7 - Big Horn 199.5 MW owned 8 - Pebble Springs 98.7 MW owned Peñascal II 202 MW owned
 EASTERN REGION Current as of May 1, 2010 Colorado Green 81 MW Owned (162 MW Project) Lempster 24 MW Owned Maple Ridge MW Owned (231 MW Project) Peñascal 202 MW Owned 146 MW Owned Barton Chapel 120 MW Owned Farmers City Dry Lake 63 MW Owned Providence Heights 72 MW Owned Streator Cayuga Ridge 300 MW owned Rugby MW owned 1 - Buffalo Ridge 50.4 MW owned 2 - MinnDakota 150 MW owned 3 - Moraine 51 MW owned 4 - Moraine II 49.5 MW owned 5 - Trimont 101 MW owned 6 - Elm Creek 99 MW owned 7 - Flying Cloud 43.5 MW owned 8 - Winnebago 20 MW owned 9 - Top of Iowa II 80 MW owned 10 - Barton 160 MW owned 1 - Klondike III a 76.5 MW owned 2 - Hay Canyon MW owned 3 - Klondike 24 MW owned 4 - Klondike III MW owned 5 - Star Point 99 MW owned 6 - Klondike II 75 MW owned 7 - Big Horn MW owned 8 - Pebble Springs 98.7 MW owned Peñascal II 202 MW owned")
5
NC wind market drivers… NC Renewable Energy & Energy Efficiency Portfolio Standard (REPS) – passed August 20, 2007 – Investor Owned Utilities must provide 12.5% by 2021 People and businesses prefer Green Power Fixed fuel cost Wind power is a local resource…not imported! 5

6
3 requirements for a wind project… Wind –Annual average speed > 15 mph Transmission –Location and capacity Land –Unconstrained, buildable, privately owned 6

7
~330’ ~475’ Swept area = 1.6 acres Typical Wind Turbine (Gamesa G90) ~295’ 2.0MW capacity Energy for 500- 600 homes 9-19 RPMs Senses wind speed & direction Rotates 360˚ Blades have adjustable pitch
 ~295’ 2.0MW capacity Energy for homes 9-19 RPMs Senses wind speed & direction Rotates 360˚ Blades have adjustable pitch")
8
Trim Trimont - MN

9
Win Winnebago – IA

10
Klondike (OR)
")
11
Wind energy projects are… An economic driver –Turbine lease payments to landowners –Property tax revenue with minimal cost –Construction jobs and supplies sourced locally & regionally –NC Dept of Commerce estimates that a 300MW project in NE NC would create 48-139 new jobs and generate $89-108 MM annually. 11

12
12 Wind energy projects are… widely accepted

13
Questions??? 13 Craig Poff Senior Business Developer cpoff@iberdrolaren.com

14
Wind energy development process Find the wind & transmission Measure the wind’s characteristics Obtain rights to land Permitting & engineering Construction Commissioning & Commercial Operation

15
What about hurricanes? We have first hand experience developing coastal sites –Penascal – Kennedy County TX –Jersey Atlantic – New Jersey The project design will consider frequency and intensity of hurricanes Design contemplates storm surge/flooding Over ~ 50 mph, turbine shuts down –Blades are feathered –Turbine faces into and follows the wind 15

16
16 Compare the impacts…

17
Electricity expenditures are rising… 17 Source: Bureau of Labor Statistics, http://www.bls.gov/opub/mlr/2008/04/art1full.pdf

18
Energy Subsidies Black, Not Green Federal Subsidies (2002-08) Fossil Fuels $72.5 billion Renewable Energy $29.0 billion $12.2 billion Traditional Renewables $16.8 billion Corn Ethanol $2.3 billion Carbon Capture & Storage $70.2 billion Traditional Fossil Fuels $2.0 $6.0$6.2 $0.3 Tax Breaks (Outer Ring) Direct Spending (inner circle) $5.0$11.8 $16.3$53.9 All Subtotals in $ Billions Climate Protecting Damaging Source: Tommy McCall, Environmental Law Institute (compiled from IRS, U.S. DOE, Congressional Joint Committee on Taxation, Office of Management and Budget, & U.S. Department of Agriculture data)
.")
19
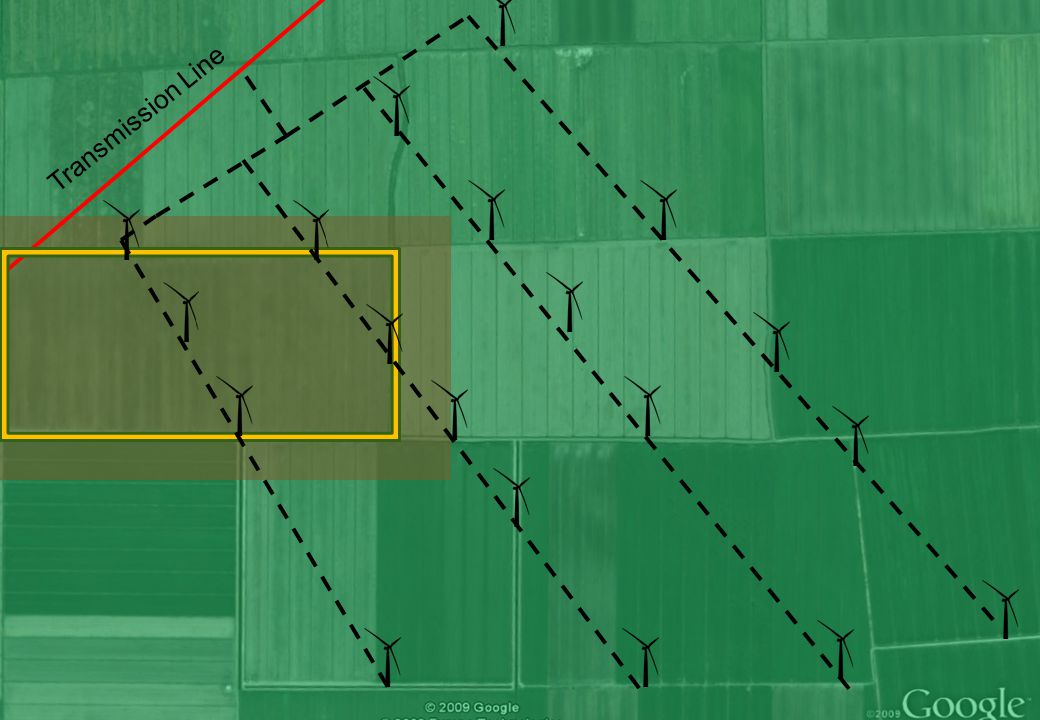
Transmission Line

Similar presentations


 Homes Farms Remote Application Intermediate (10-250 kW) Village Power Hybrid Systems Distributed Power Large.>")


