Download presentation
Presentation is loading. Please wait.

1
INCREASING INFANT MORTALITY RATES (IMR) IN LOUISIANA: Public Health Emergency Or Reporting Artifact? Juan M. Acuña M.D. CDC Maternal and Child Health Epidemiologist Louisiana Office of Public Health

2
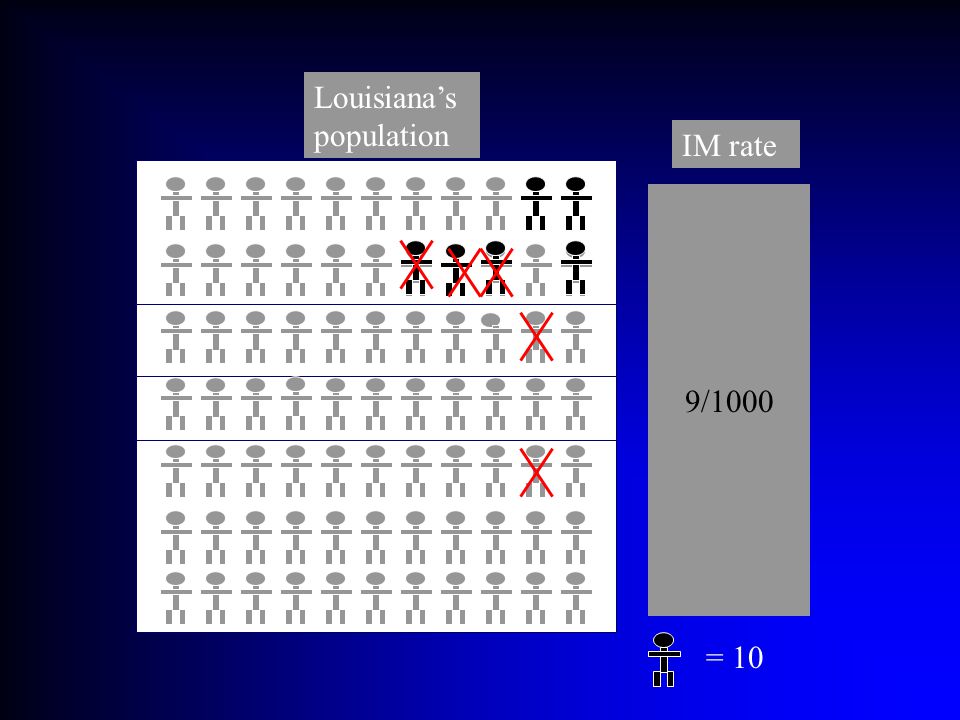
Background Louisiana ranks consistently among the 5 states with the highest IMR The IMR decline had followed the US The IMR hit a record low in 2000 (8.9. All IMR in deaths per 1000 live births). The IMR increased to 9.8 in 2001 and (in recently released data) to 10.2 in 2002. Strong political and media attention. Data from years 1997 to 2002 was analyzed to explain this increase.
. The IMR increased to 9.8 in 2001 and (in recently released data) to 10.2 in Strong political and media attention. Data from years 1997 to 2002 was analyzed to explain this increase..")
3
Methods Analysis of Louisiana’s birth file and linked birth- infant/fetal death file Data from 1997-2002. One-sided Kendall’s Tau-b correlation was used to evaluate statistical significance of trends Indirect adjustment of rates and Z scores Multivariate analysis models GENMODE / GLIMMIX models

4
Louisiana’s 64 Parishes and 9 Administrative Regions

5
Results – Step I Analysis of crude rates: –Overall crude rates by state and region –Overall rates by race, birth weight strata including: PPOR methodology Finer stratification by birth weight categories –Analysis of reporting of deaths

6
Infant mortality rates, all races,, LA 1999-2001 9.88.99.2 State 7.55.97.3 9 10.112.311.4 8 11.211.712.1 7 9.99.37.1 6 9.78.98.4 5 10.18.510.3 4 10.110.610.4 3 10.38.78.6 2 9.67.08.1 1 20012000 1999 Region 10.3 9.8 * 12.7 * 12.2 * 6.8 10.2 * 10.1 9.5 10.5 * 2002 * p<o.o5

7
Feto-Infant Mortality, Louisiana, 1997-2002 20004.6 2.01.72.4 10.7 20014.8 2.21.72.7 11.3 1997-994.5 2.41.72.5 11.1 20024.9 2.21.72.7 11.4

9
Results – Step II Adjustment of rates –Indirect adjustment of overall crude rates –Stratified adjustment By birth weight –Birth weight specific mortality –Birth weight distribution

11
Louisiana’s 9 administrative Regions’ births by race Black: 48% White: 51% Black: 35% White: 65% Black: 30% White: 70% Black: 55% White: 45%

12
Adjusted risk for IM, Louisiana 1996-2002

13
32.5% 12.5% 30% 30/100 population 5/100% rate partial rate D = pi+Pi (ci – Ci) ci – Ci (pi-Pi) 2 2
 ci – Ci (pi-Pi) 2 2")
14
Mortality Birthweight Distribution Birth weight- Specific Mortality Higher rate because there are more small babies Higher rate because the babies die more Where are we? % has two components: BWD and BWSM

15
Perinatal mortality Hospital X Birth Weight BWSM BWD PMR: 22.6 per 1000 LB+ FD

16
Results - Step III Multivariate analysis –Adjusted regression models including confounders and interaction models (assuming independence of variables) –GENMODE / GLIMMIX models Analysis of correlated data (non-independence for variables such as level of attention, access to services, prenatal care, etc)
 –GENMODE / GLIMMIX models Analysis of correlated data (non-independence for variables such as level of attention, access to services, prenatal care, etc)")
17
Multivariable Analysis Risk factorsOR (95% CI)P valueReference Education <10 grade2.1 (1.6, 2.7)0.000 > 12 grade 10-12 grade1.6 (1.3, 1.9)0.000 MaritalNot married1.2 (1.0, 1.4)0.046Married GenderMale1.3 (1.1, 1.4)0.001Female Prenatal care Intermediate1.2 (0.9, 1.5)0.125 Adequate Inadequate1.2 (1.0, 1.5)0.048 Gestation24-36 weeks2.3 (1.8, 2.8)0.000> 36 weeks Race White 500-149930.1(22.3,43.1)0.000 >= 2500 grams 1500-24994.43.35.90.000 Black 500-149911.1 (8.2, 15.0)0.000 >= 2500 grams 1500-24992.0 (1.5, 2.6)0.000 Birth weight (grams) 500-1499White1.9 (1.6, 2.2)0.000Black 1500-2499White1.5 (1.1, 1.9)0.000Black >=2500Black1.5 (1.2, 1.8)0.000White
P valueReference Education <10 grade2.1 (1.6, 2.7)0.000 > 12 grade grade1.6 (1.3, 1.9)0.000 MaritalNot married1.2 (1.0, 1.4)0.046Married GenderMale1.3 (1.1, 1.4)0.001Female Prenatal care Intermediate1.2 (0.9, 1.5)0.125 Adequate Inadequate1.2 (1.0, 1.5)0.048 Gestation24-36 weeks2.3 (1.8, 2.8)0.000> 36 weeks Race White (22.3,43.1)0.000 >= 2500 grams Black (8.2, 15.0)0.000 >= 2500 grams (1.5, 2.6)0.000 Birth weight (grams) White1.9 (1.6, 2.2)0.000Black White1.5 (1.1, 1.9)0.000Black >=2500Black1.5 (1.2, 1.8)0.000White")
18
Conclusions One size does not fit all Neither crude nor adjusted rates are the only analytical tools for the analysis of risk [for death] in a complex [state] population Analysis of reporting is mandatory Be creative, be careful (program and policy people rely on your skills)
![Conclusions One size does not fit all Neither crude nor adjusted rates are the only analytical tools for the analysis of risk [for death] in a complex [state] population Analysis of reporting is mandatory Be creative, be careful (program and policy people rely on your skills)](http://images.slideplayer.com/13/4015770/slides/slide_18.jpg "Conclusions One size does not fit all Neither crude nor adjusted rates are the only analytical tools for the analysis of risk [for death] in a complex [state] population Analysis of reporting is mandatory Be creative, be careful (program and policy people rely on your skills)")
19
Crude Rates Crude rate errors Adjusted rates Multivariate analysis Correlation analysis GIS Trend analysis Survival analysis At least do: Analytical Model

Similar presentations

 2011 Gestation Birthweight Age of Mother Ethnicity Cause of death Jonnie Dance – Senior Public Health Analyst Teresa.>")


 Health Department.>")


 Marion County Health Department.>")