Download presentation
Presentation is loading. Please wait.

1
MTSS: T IERS OF I NSTRUCTION AND INTERVENTION AT P ALM B AY A CADEMY Janet Stephenson Brevard Public Schools MTSS Trainer

2
Big Ideas of MTSS Multi-Tiered System of Support ► Being proactive ► Early intervention for those who need it ► High quality instruction using best practices in Tier 1 ► Data-based decision making ► Identifying the level of services needed by which students ► Problem Solving Method ► More than just about eligibility

3
3 Florida SLD Criteria for Eligibility after July 10, 2010 Underachievement in: Oral expression Listening comprehension Written expression Basic reading skills Reading fluency skills Reading comprehension Mathematics Calculation Mathematics problem-solving RTI: Resource intensive or insufficient response to scientific, research- based intervention Conditions 1 and 2 not primarily the result of: Visual, hearing or motor disability Intellectual disability Emotional/Behavioral disability Cultural factors Irregular attendance Environmental or economic disadvantage Classroom behavior Limited English proficiency Condition 1Condition 2Condition 3 ++

4
How Will We Respond When Students Don’t Learn?

5
Special Education General Education Sea of Ineligibility Who are our students who struggle?

7
R T I WILL WORK IF IT IS IMPLEMENTED AS A SCHOOL AND STUDENT IMPROVEMENT INITIATIVE. I T WILL NOT WORK WHEN IMPLEMENTED ONLY TO DETERMINE ELIGIBILITY.

8
O NE SYSTEM SUPPORTING IT ALL MTSS O NE SYSTEM SUPPORTING IT ALL W HAT H APPENED T O R T I?

9
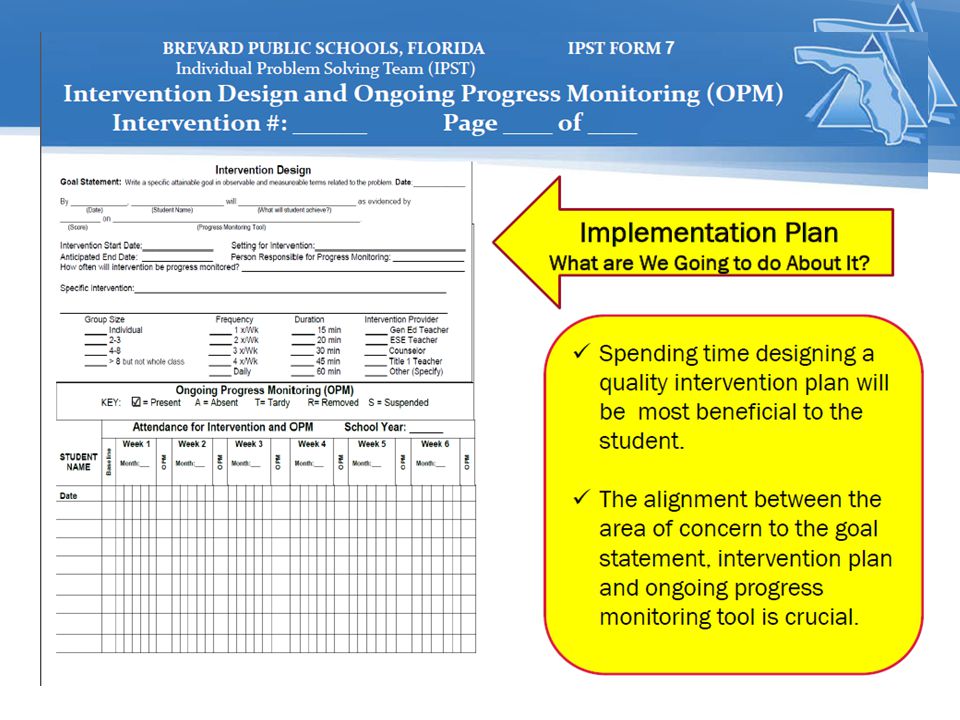
Problem Solving? Define the Problem What Do We Want Students to KNOW and Be Able to DO? Define the Problem What Do We Want Students to KNOW and Be Able to DO? Problem Analysis Why Can’t They DO It? Implement Plan What Are WE Going To DO About It? Evaluate Did It WORK? (Response to Intervention – RtI)
.")
10
RtI… The 5 Step Process Another Way of Saying It… 1. Find ‘em (assessment) 2. Do Something with ‘em (interventions) 3. Watch ‘em (progress monitoring) 4. Make informed decisions (data-based) 5. Change.. if necessary (instructional modification) 10
 2. Do Something with ‘em (interventions) 3. Watch ‘em (progress monitoring) 4. Make informed decisions (data-based) 5. Change.. if necessary (instructional modification) 10.")
11
What are the components of MTSS? Speaking the LINGO! 1. Tiers of Intervention: Students who do not respond to high-quality classroom instruction (Tier 1) and intervention (Tier 2) receive more intensive, individualized research-based interventions (Tier 3). Tiers are the level of intensity of the intervention. 2. Progress Monitoring: Data-based documentation of repeated assessments reflecting student progress. 3.Data Based Decision Making: Students who don’t respond to these interventions or require a highly individualized program to progress are evaluated in a more comprehensive manner.
 and intervention (Tier 2) receive more intensive, individualized research-based interventions (Tier 3). Tiers are the level of intensity of the intervention. 2. Progress Monitoring: Data-based documentation of repeated assessments reflecting student progress. 3.Data Based Decision Making: Students who don’t respond to these interventions or require a highly individualized program to progress are evaluated in a more comprehensive manner..")
12
Multi-tier System of Supports (MTSS): Response to Instruction/Intervention (RtI) An Overview of Data-based Problem-solving within a Multi-tier System of Supports in Florida’s Public Schools 12 Intensive, Individualized Supports Intensive interventions based on individual student needs Students receiving prolonged interventions at this level may be several grade levels behind or above the one in which they are enrolled Progress monitoring occurs most often to ensure maximum acceleration of student progress If more than approximately 5% of students are receiving support at this level, engage in Tier 1 and Tier 2 level, systemic problem-solving Targeted, Supplemental Supports Interventions are based on data revealing that students need more than core, universal instruction Interventions and progress monitoring are targeted to specific skills to remediate or enrich, as appropriate Progress monitoring occurs more frequently than at the core, universal level to ensure that the intervention is working If more than approximately 15% of students are receiving support at this level, engage in Tier 1 level, systemic problem-solving Core, Universal Supports Research-based, high-quality, general education instruction and support Screening and benchmark assessments for all students Assessments occur for all students Data collection continues to inform instruction If less than approximately 80% of students are successful given core, universal instruction, engage in Tier 1 level problem-solving
: Response to Instruction/Intervention (RtI) An Overview of Data-based Problem-solving within a Multi-tier System of Supports in Florida’s Public Schools 12 Intensive, Individualized Supports Intensive interventions based on individual student needs Students receiving prolonged interventions at this level may be several grade levels behind or above the one in which they are enrolled Progress monitoring occurs most often to ensure maximum acceleration of student progress If more than approximately 5% of students are receiving support at this level, engage in Tier 1 and Tier 2 level, systemic problem-solving Targeted, Supplemental Supports Interventions are based on data revealing that students need more than core, universal instruction Interventions and progress monitoring are targeted to specific skills to remediate or enrich, as appropriate Progress monitoring occurs more frequently than at the core, universal level to ensure that the intervention is working If more than approximately 15% of students are receiving support at this level, engage in Tier 1 level, systemic problem-solving Core, Universal Supports Research-based, high-quality, general education instruction and support Screening and benchmark assessments for all students Assessments occur for all students Data collection continues to inform instruction If less than approximately 80% of students are successful given core, universal instruction, engage in Tier 1 level problem-solving")
13
– Core instruction – differentiated, high quality – Identify at risk students (FIND ‘EM) FAIR, observation, FCAT, formative assessments – Interventions, progress monitoring – Teacher Data Teams that can make collaborative decisions Problem Solving method Is what we are doing working? Is there a better way? Getting Started

14
W HAT DOES TIER 1 LOOK LIKE?

15
Traditional Instruction vs. Standards-Based Instruction Traditional Classroom Standards-Based Classroom Whole class instruction dominates Student differences are acted upon when problematic Mastery of facts is focus of learning Coverage of texts and curriculum drives instruction Lesson topic is selected from curriculum and/or text Single option assignments are the norm Assessment is most common at the end of learning to see “who got it” A single form of assessment is often used Teachers administers tests then moves on to curriculum Many instructional strategies are used Students differences are studied as a basis for planning Use of essential skills to make sense of and understand key concepts & big ideas are the focus of learning Student readiness, interest, and learning profile shape instruction Lesson topic is selected based on state standards Multi-option assignments are frequently used Assessment is ongoing to understand how to make instruction more responsive to learner Students are assessed in multiple ways Teachers assess and reteach based on student mastery level

16
W HAT DOES PROBLEM SOLVING LOOK LIKE AT TIER 1?

17
Looking at Tier 1 Data - Grade 3 Math Inventory Define the Problem Student Name Item s 12345678910111213141516171819202122232425 Student 1 72A/1B/1A/0D/1C/1A/0C/0A/0A/1D/1C/1B/0C/0A/1B/1A/1B/1 D/1C/1C/0D/1B/1A/1D/1 Student 2 72C/0B/1C/1D/1B/0C/1B/0B/1A/1D/1C/1D/1D/0A/1A/0A/1C/0D/0D/1C/1A/1D/1B/1A/1D/1 Student 3 88A/1B/1C/1D/1C/1A/0D/1B/1A/1D/1C/1D/1A/1 A/0B/0B/1 D/1C/1A/1D/1B/1A/1D/1 Student 4 72A/1B/1C/1D/1C/1D/0D/1B/1A/1D/1C/1A/0C/0A/1B/1A/1C/0B/1D/1C/1C/0A/0B/1A/1A/0 Student 5 84A/1B/1C/1D/1C/1 D/1B/1A/1D/1C/1D/1A/1 A/0B/0B/1 D/1C/1A/1D/1C/0D/0D/1 Student 6 40B/0B/1A/0D/1B/0A/0C/0D/0A/1D/1D/0A/0C/0A/1C/0B/0C/0B/1D/1A/0A/1B/0B/1A/1A/0 Student 7 100A/1B/1C/1D/1C/1 D/1B/1A/1D/1C/1D/1A/1 B/1A/1B/1 D/1C/1A/1D/1B/1A/1D/1 Student 8 64A/1B/1D/0D/1B/0D/0B/0B/1A/1D/1C/1D/1B/0A/1D/0C/0B/1 D/1C/1C/0A/0B/1A/1D/1 Student 9 96A/1B/1C/1D/1C/1 D/1B/1A/1D/1C/1D/1A/1 B/1A/1B/1 D/1C/1A/1D/1B/1A/1B/0 Student 10 80A/1B/1B/0D/1C/1A/0D/1A/0A/1D/1C/1D/1C/0A/1D/0A/1B/1 D/1C/1A/1D/1B/1A/1D/1 Student 11 68A/1B/1A/0D/1C/1 C/0A/0A/1D/1C/1D/1B/0A/1B/1B/0A/0B/1D/1C/1D/0D/1B/1D/0D/1 Student 12 88A/1B/1C/1D/1C/1 D/1B/1A/1D/1C/1D/1C/0A/1B/1A/1B/1 D/1C/1A/1D/1D/0 D/1 Student 13 88A/1B/1A/0D/1C/1 D/1B/1A/1D/1C/1D/1C/0A/1D/0A/1B/1 D/1C/1A/1D/1B/1A/1D/1 Student 14 88A/1B/1C/1D/1C/1A/0D/1B/1A/1D/1C/1D/1A/1 D/0A/1B/1 D/1C/1C/0D/1B/1A/1D/1 Student 15 72A/1B/1A/0D/1C/1A/0D/1B/1A/1D/1C/1D/1D/0A/1B/1A/1B/1 B/0 A/1A/0C/0A/1D/1 Student 16 92A/1B/1C/1D/1C/1 D/1B/1A/1D/1C/1D/1B/0A/1A/0A/1B/1 D/1C/1A/1D/1B/1A/1D/1 Student 17 56A/1B/1B/0A/0B/0C/1A/0B/1A/1D/1A/0D/1D/0A/1A/0A/1C/0B/1D/1A/0C/0B/0B/1A/1D/1 Student 18 80A/1B/1C/1D/1C/1 D/1B/1A/1D/1C/1D/1B/0A/1D/0A/1C/0B/1D/1C/1A/1D/1A/0A/1C/0 Correct Responses 161810171410121418 16155187131217 151213141514 Incorrect Responses 208148640023130115611365434 Correct Response Percentag e 89% 100 %56%94%78%56%67%78% 100 % 89%83%28% 100 %39%72%67%94% 83%67%72%78%83%78% A 89% 28%6% 33%6%17% 100 % 6%11%28% 100 %28%72%6% 11%67%17%6%83%11% B 6% 100 %11% 22% 11%78% 6%22% 39%22%67%94%6% 11%78% 6% C 56% 78%56%17% 89% 33% 6% 28% 83%28% 11% 6% D 94% 11%67%6% 100 %6%83%17% 28% 6%94% 6%72%6%17%78% 1.What are some areas of concern? 2. How would your instructional action plan be impacted by this assessment? 3.What skills would an instructor address in the Universal, Core Instruction(Tier 1) ? 4. How would an instructor group students using this data?
 . 4. How would an instructor group students using this data .")
18
How Do We Find Them? Who is not meeting grade level expectations? – FAIR – DRLA – KINDERGARTEN LITERACY SCREENER – MATH ASSESSMENTS – RUNNING RECORDS – ATTENDANCE

19
W E HAVE FOUND THEM ! T IER 2: D ESIGNING I NTERVENTIONS D OING S OMETHING W ITH ‘ EM

20
W HAT DO WE DO FOR STRUGGLING LEARNERS ?

21
Diagnostic Assessments PSI – Phonics Screener PASI – Phonological Awareness DAR – Diagnostic Assessment of Reading ORF – Oral Reading Fluency >Error Pattern Analysis Math – Easy CBM Probes

22
The major purpose for administering diagnostic tests is to provide information that is useful in planning more effective instruction. Purpose of Diagnostic Assessments

23
T HERE IS NO AMOUNT OF INTERVENTION THAT CAN SUBSTITUTE QUALITY INSTRUCTION.

24
Progress Monitoring Data : Is What We Are Doing Working? Progress monitoring data Determine response to interventions using PASI PSI ORF FAIR - OPM 24

26
Let’s Get This Baby Off the Ground!

27
Problem Solving Teams School Leadership Team Teacher Data Team Individual Problem Solving Team (IPST)
")
28
TEACHER DATA TEAMS None of us is as smart as all of us!!! Ken Blanchard Ken Blanchard

29
Highlights Started with expectations for the meeting Focused on data and identifying why students are struggling Problem-solving as a team Made a plan to progress monitor student(s) exiting intervention All staff who work with the students are at the table and participating
 exiting intervention All staff who work with the students are at the table and participating")
30
The Work ► Discussing ACADEMIC & BEHAVIOR NEEDS of students. ► Problem Solving & Developing intervention plans ► Looking at Data-Are students being successful? ► Solving the problems that we identify at Tiers 1, 2, and 3?

31
Interventions Let’s Discuss

32
Where do I get these INTERVENTIONS?

35
Inventory Your Resources And Try to Develop More!

39
Riviera Elementary – Grade 2 Intervention Groups

41
Welcome! 41 Behavior: What do I do?

42
Great Behavior Resource

43
How to Find Behavior Site… MTSS Web Site – Resource Links – Polk County Behavior Or Google: : Polk Elementary PBS

44
– Core instruction – differentiated, high quality – Identify at risk students (FIND ‘EM) FAIR, observation, FCAT, formative assessments – Interventions, progress monitoring, using DATA – Teacher Data Teams that can make collaborative decisions Problem Solving method Is what we are doing working? Is there a better way? Getting Started

45
Paradigm Shift Eligibility Focus Diagnostic/Test & Place Model PreReferral Get label Outcome Focus Problem Solving/ Response to Intervention Model Get help

Similar presentations


 Progress Monitoring Interventions Tiers Training/Materials Problem Solving Model Allocation of Resources.>")


 Secondary Model for Intervention This ppt is an adaptation of a specific PISD Training on RTI, The Educational Testing and.>")


 Presented by Ashley Adamo and Brian Mitchell January 6, 2012.>")