Download presentation
Presentation is loading. Please wait.

1
Measuring Two-Dimensional Surface Velocity Distribution
using Two RiverSondes Ralph T Cheng CODAR OS and U. S. Geological Survey Jon R. Burau and James DeRose U. S. Geological Survey Donald E. Barrick, Calvin C. Teague and Peter M. Lilleboe CODAR Ocean Sensors

2
Outline Radar Technology for Surface Velocity RiverSonde System
Multi-Dimensional Channel Flows Two-RiverSonde for Two-Dimensional Surface Velocity Distribution Proof-of-the-Concept Experiments Threemile Slough Sacramento River at Georgiana Slough, CA Discussion of Results

3
The widely used approach to estimating total roughness for hydraulic studies is to first estimate a base value for the bed material, and then to add components to this base value for various extraneous flow-retarding elements. These components include: surface irregularities variations in shape and size of the channel obstructions vegetation The composited value is then multiplied by a correction factor for meandering of the channel.

4
RiverSonde System UHF radar: 0.7-m radar wavelength (435 MHz)
3-yagi antenna system on bank Bragg scatter from 0.35-m wavelength water waves Doppler shift gives radial velocity, water phase velocity known from their wavelength Time delay (time-gating) gives distance MUSIC direction finding gives direction Estimate along-channel flow from radial velocity Straight channel: assume flow parallel to banks Complex geometry: calculate total vectors using 2 RiverSondes
 gives distance. MUSIC direction finding gives direction. Estimate along-channel flow from radial velocity. Straight channel: assume flow parallel to banks. Complex geometry: calculate total vectors using 2 RiverSondes.")
5
Typical RiverSonde Deployment
Mean Flow Radar

6
Example of Radial Vectors
Average over 1 hour 5 m range cells 1 m/s ~ 10 m Gaps may be due to blockage by trees SNR limits coverage at far bank

8
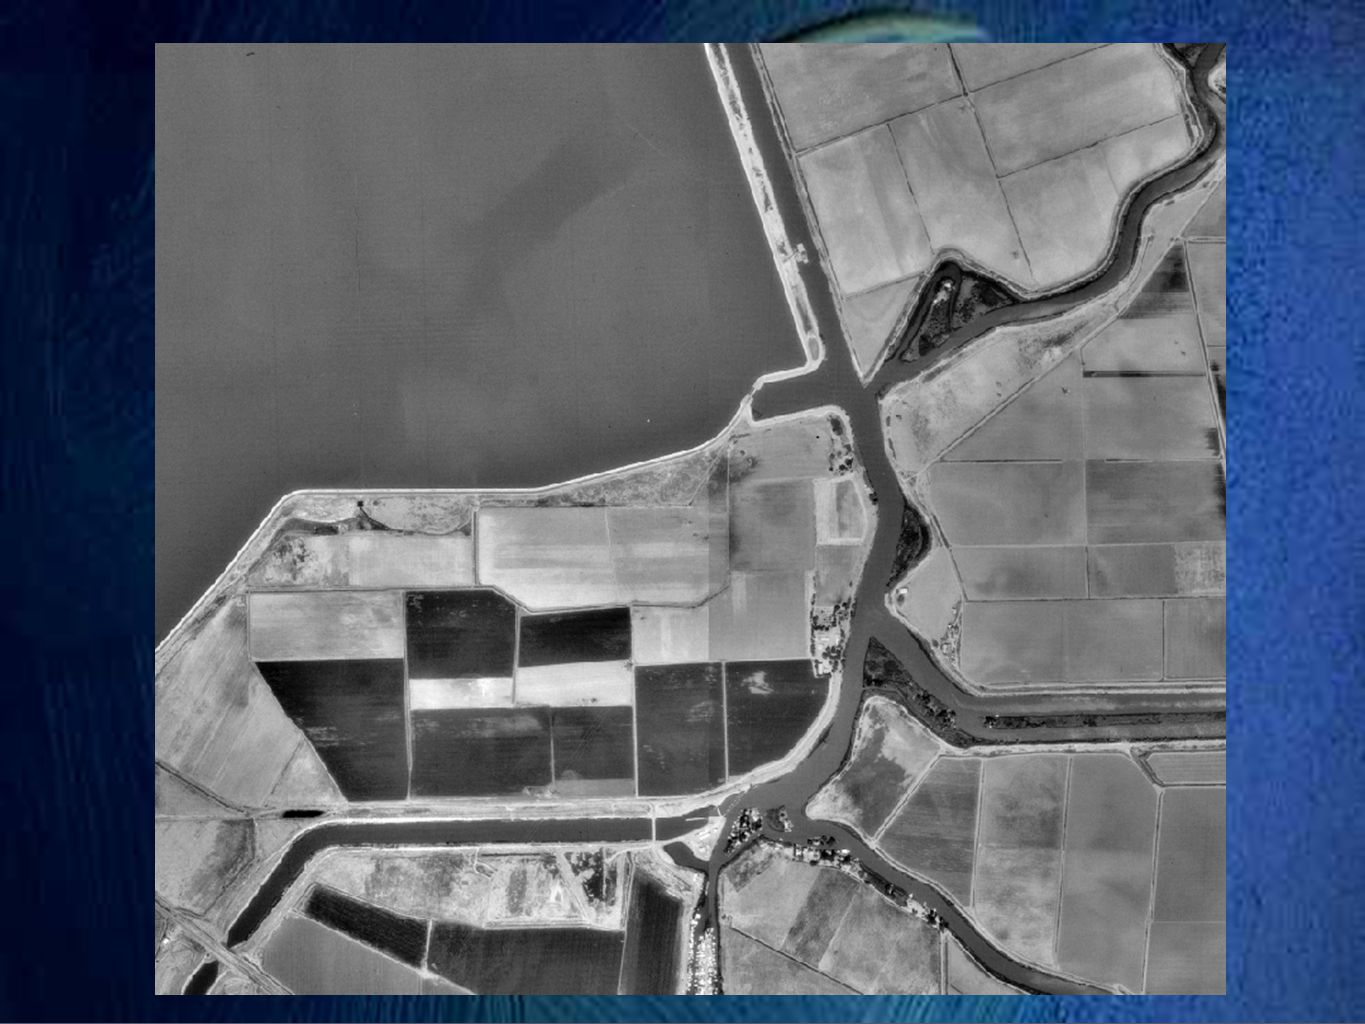
Sacramento River near Walnut Grove, CA
Delta Cross-Channel, Georgiana Slough

9
Concept of Two RiverSondes
for Two-Dimensional Surface Velocity Distribution Radar line of sight RiverSonde A O A B OA = Radial Velocity A OB = Radial Velocity B OC = Total Velocity River Bank C RiverSonde B

10
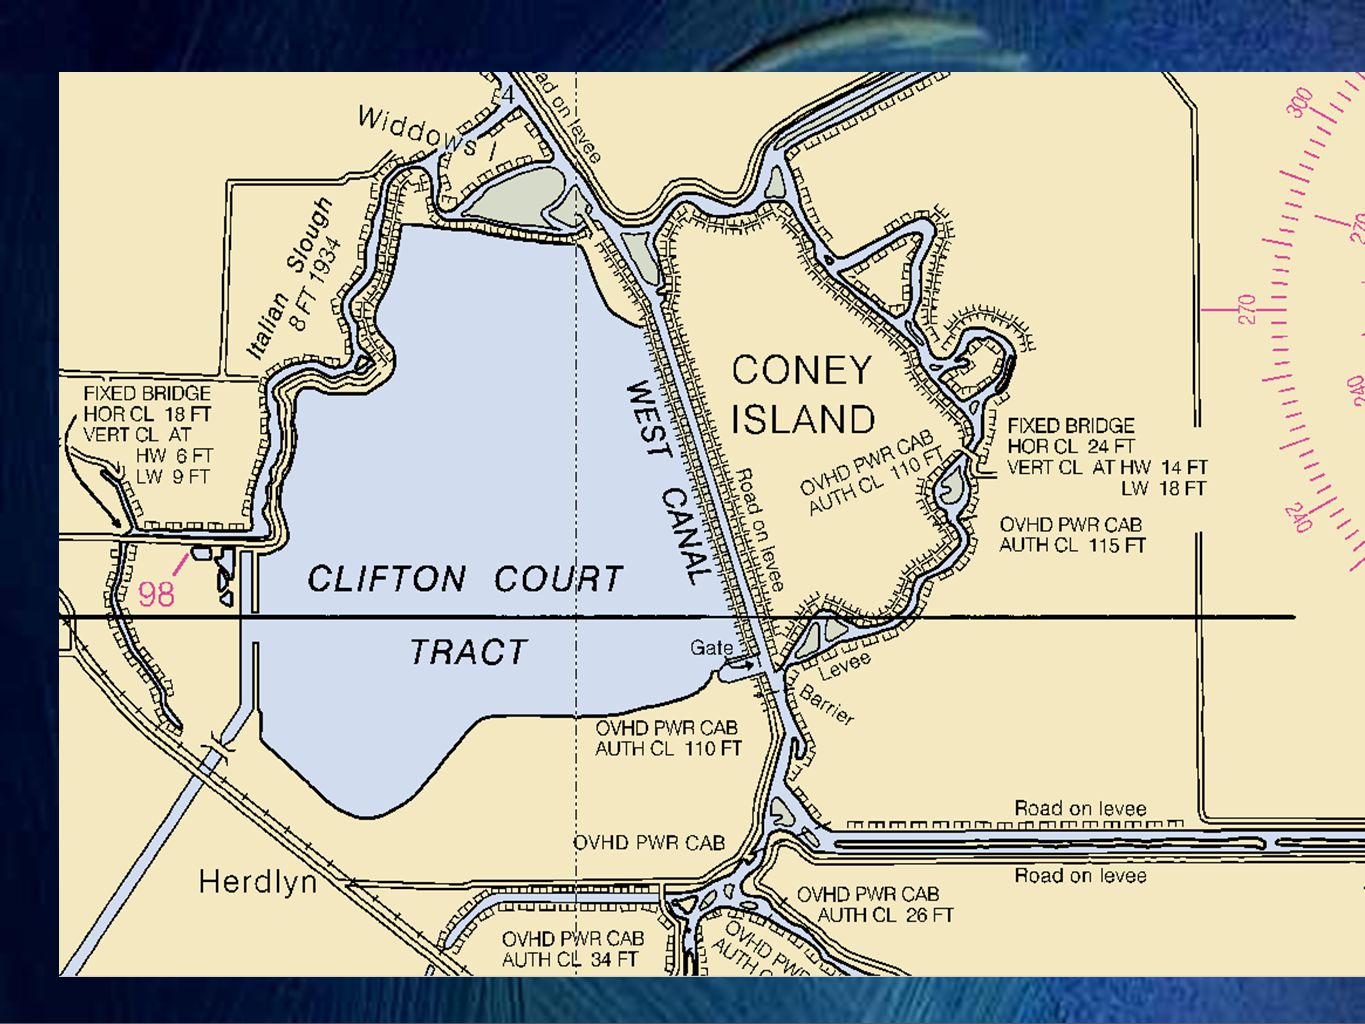
Continuing Development of RiverSonde at Three Mile Slough
San Francisco Bay-Delta (Cooperation with California District)
")
11
Threemile Slough, California
Straight channel between Sacramento and San Joaquin Rivers in California Delta Tidally-dominated flow In operation for several years with a single RiverSonde One day proof-of-the-concept experiment (21 February 2007) with 2 RiverSondes Antenna interference? Antenna patterns measured in field
 with 2 RiverSondes. Antenna interference Antenna patterns measured in field.")
12
RiverSondes at Threemile Slough
North South

13
Velocity Time-series at TMS

14
Threemile Slough High Velocity
02/22 00:30 GMT 02/21 19:30 GMT

15
Threemile Slough, just Before Slack

16
Threemile Slough, just After Slack

17
BASIC FINDINGS: Two-RiverSonde operating in close proximity does not have interference issues Total vectors are generated with same software used in SeaSonde for ocean currents 5- or 10-m grid spacing Manual masking of river banks Observed complex flow pattern during tidal reversal

18
Proof-of-the-Concept II: April 23-25, 2007 Sacramento River at Georgiana Slough, CA
Tidally-influenced flow Flow patterns affect fish migration 2 RiverSondes 1.5 days with units on same bank 0.5 day with units on opposite banks Antenna patterns measured with a transponder on a boat USGS measurements Boat-mounted ADCP transects every 30 min for 12 hours Four Flow Stations in the region

19
Proof-of-the-concept at Georgiana Slough
Two-RiverSonde Experiment for 2D Velocity Mapping

20
View From Levee Site Georgiana Slough Sacramento River DWRG LVEG

21
Data Coverage

22
Preliminary Results: Same Bank

23
Preliminary Results: Opposite Bank

24
Slack or reversal: Case 1

25
Slack or Reversal: Case 2

26
Preliminary Results: April 24, 2007 13:06
ADCP, USGS 2-RiverSonde, CODAR ADCP, USGS

27
Numerical Hydrodynamic Model
B.C. specified Model results compared Numerical Hydrodynamic Model DCC Closed B.C. specified Model results compared B.C. specified

28
Implementing a Detailed Numerical Model

29
Implementing a Detailed Numerical Model

30
Preliminary Conclusion
2-RiverSonde operation works well Both units on same bank or on opposite bank Total vectors generated with same software used with SeaSonde for ocean currents Unfortunately ADCP transects did not overlap with the complex flow patterns observed by 2-RiverSonde Mistakes in the current experiment lead to a better design of the next experiment Further experiment and Comparisons with in-situ data and numerical model underway

Similar presentations

. 1. Delta boundary, daily inflow 2. Extend upstream channel by 45 miles, daily inflow 3. Hourly inflow at Freeport boundary.>")


,>")


 Coastal HF Radar IMCS Building Room 214C 732-932-6555 ext 251 Dunes of sand.>")


>")

