Download presentation
Presentation is loading. Please wait.

1
The Seamless GIS Basemap Project Louisiana Department of Transportation and Development November 10, 2011

2
History of Mapping Louisiana ► 1928 – Act 159 of 1928 establishes topographic mapping authority ► 2000 – The USGS ceases Topographic Map Program ► 2002 – The National Map becomes USGS mapping priority ► 2007 – USGS announced that it had no further work to complete in Louisiana ► Aug. 2007 – DOTD partners with GDM International Services Inc to provide topographic mapping services for the State. ► 2007 - The Louisiana Seamless GIS Basemap Project begins with 4 main goals: Denote and acquire “best available” digital data from Local, State, and Federal sources Assess, revise, and compile sources into Seamless GIS Basemap Update National Hydrography Dataset watershed within project area Create USGS-like Topographic Maps for distribution ► 2010 – Act 782 of 2010 establishes La. R. S. 48:36 Topographic Mapping

3
Louisiana Act 782 of 2010 La. R. S. 48:36 Topographic Mapping Develop and maintain a statewide digital geospatial database Develop and maintain a statewide digital geospatial database Act as authority for geographic names Act as authority for geographic names Set standards for the mapping of topographic features Set standards for the mapping of topographic features Plan and manage data collection for incorporation into a statewide database Plan and manage data collection for incorporation into a statewide database Promulgate rules and regulations… as are necessary for the planning and managing of the geospatial data. Promulgate rules and regulations… as are necessary for the planning and managing of the geospatial data.

4
Better Sources Better Data 1:1,000 scale Lakeshore Drive, Baton Rouge 1998 Lakeshore Drive, Baton Rouge 2004 Lakeshore Drive, Baton Rouge 2005 Lakeshore Drive, Baton Rouge 2008 Lakeshore Drive, Baton Rouge 2010

10
BLM, Census, State Data Orthophotography LiDAR USGS NHD Census, State Data BLM, Census, State Data USGS Quads, DOQQ GNIS, Local Data Traditional Basemap Sources Land Use Vegetation Contours Hydrography Transportation Boundaries Structures Annotation LA Seamless Database New Digital Database Format

11
Data Consistency Issues USGS maps are comprised of seven “framework themes” (water, elevation, transportation, boundaries, benchmarks, vegetation, and structures). USGS did not update all themes simultaneously. On this map, USGS has not updated the hypsography theme. So, the old elevation contours (brown) lie in the updated water (blue). The thick red lines show the photo-revised shoreline and other water features from the 2004 orthophotos.
 lie in the updated water (blue). The thick red lines show the photo-revised shoreline and other water features from the 2004 orthophotos..")
12
Maps, Data, & Imagery Do Not Match The yellow lines are where best-available digital data show the land-water boundary. The image is post hurricane orthophotography. Neither match the maps.

13
“Current” Data Does Not Edge-match As lines cross map boundaries they do not meet their counterpart on the next map.

14
How Up to Date are Louisiana’s Maps? ► All paper maps are 5 years or older ► 92% of paper maps are 10 years or older ► 74% of paper maps are 15 years or older ► 50% of paper maps are 20 years or older ► 32% of paper maps are 25 years or older ► The Catahoula Quad is 111 years old!

15
1998 Lower Vacherie Quad USGS 7.5’ Quadrangle Features marked Street locations Building locations What kind of school? What type of student body? Where is the school located?

16
2009 Lower Vacherie Quad LA DOTD 7.5’ Quadrangle Features marked Street locations Building locations Lower Vacherie Elementary School Public, Pre-K - 8 13440 Highway 644, Vacherie, LA Julie Dauzat, Principal

17
Building a Topographic Map

20
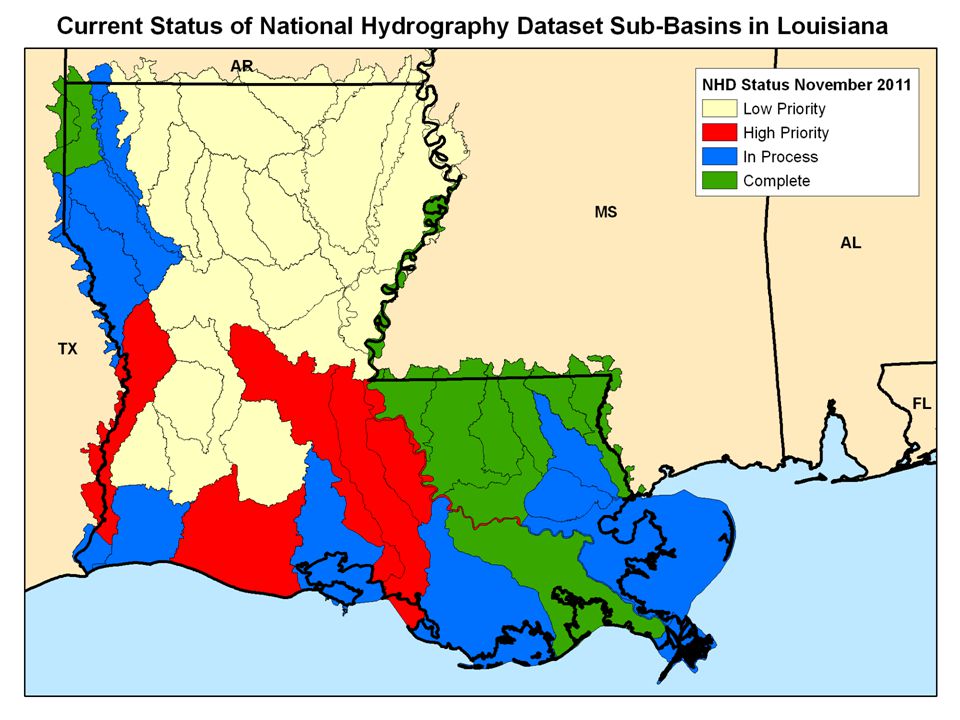
National Hydrography Dataset

21
Red features are from the NHD. Orange polygons are areas represented by NOAA as land in 1940 (most current data). These are now open water in the NHD. Where Has All the Coastline Gone?
. These are now open water in the NHD. Where Has All the Coastline Gone .")
22
Mapping a changing landscape

23
Pilot Project – Lake Maurepas ► First “Coastal Louisiana” experience – Pass Manchac

24
08090301 Existing Data

25
08090301 Final Delivery

26
08090301 Final Results ► Old methods 60,000+ features revised 8 months+ to update and revise Manual table generation ► New Methods 31,000+ features revised ~5 months to update and revise Automated table generation

27
Tools for GIS ► ESRI ArcGIS ® ► ESRI Production Mapping ® ► USGS NHD GeoConflation Tool

Similar presentations


>")
 Project MINI – WORKSHOP Thanks to… Susan Phelps, AECOM ; Jeff Simley,>")


 is composed of twelve regions. Each regional planning council is a public organization.>")

