Download presentation
Presentation is loading. Please wait.

1
HPRP Outcomes Cindy Cavanaugh, SHRA July 27, 2011

2
APR highlights ◦ Year 1 = Oct 2009 thru Sept 2009 June 2011 updates Corresponds to HUD’s 2-1-AHAR and HPRP Year 1 Summary ◦ National Comparisons, but individual programs vary widely ◦ http://www.hudhre.info/documents/HPRP_Year1Summar y.pdf http://www.hudhre.info/documents/HPRP_Year1Summar y.pdf ◦ http://www.hudhre.info/documents/2010HomelessAsse ssmentReport.pdf http://www.hudhre.info/documents/2010HomelessAsse ssmentReport.pdf Additional Sacramento data elements

3
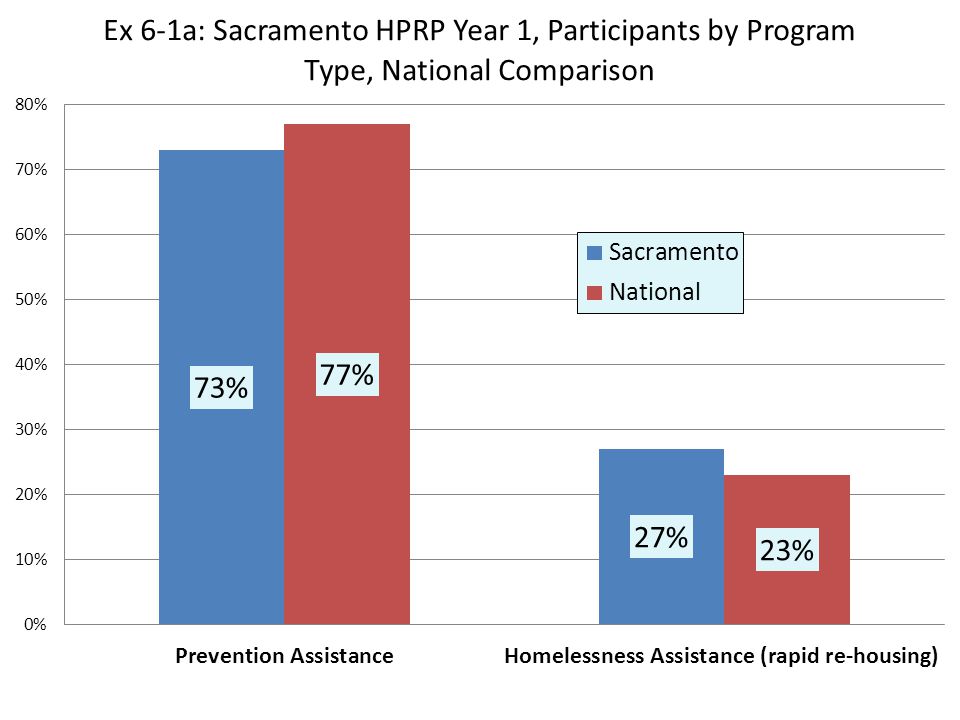
Exhibit 6-2: Persons Assisted with HPRP by Program Type & Household Type Total Persons Total All Persons Persons in Households without Children Persons in Households with Children #%#%#% Adults2,20350.3%788100.0%1,35839.0% Children2,06447.1%00.0%2,08459.9% Missing Age1172.7%00.0%361.0% Total4,384100%788100%3,478100% Total Persons Homeless Prevention All Persons Persons in Households without Children Persons in Households with Children #%#%#% Adults1,46245.7%357100.0%1,06738.5% Children1,65651.8%00.0%1,67660.5% Missing Age812.5%00.0%250.9% Total3,199100.0%357100.0%2,768100.0% Total Persons Homeless Assistance All Persons Persons in Households without Children Persons in Households with Children #%#%#% Adults74162.5%431100.0%29141.0% Children40834.4%00.0%40857.5% Missing Age363.0%00.0%111.5% Total1,185100.0%431100.0%710100.0%

5
ss Definitions ParticipantsPersons Households (HH)Individual or Family Household EligibleReceived assessment score with eligibility to receive HPRP Services ServedEnrolled in HPRP HousedReceived Financial assistance in housing ExitedExited program, (small number did not received financial assistance in housing) HomelessLiterally homeless, in place not fit for human habitation, emergency shelter HousedRent housing unit in name Staying with family or friends
Individual or Family Household EligibleReceived assessment score with eligibility to receive HPRP Services ServedEnrolled in HPRP HousedReceived Financial assistance in housing ExitedExited program, (small number did not received financial assistance in housing) HomelessLiterally homeless, in place not fit for human habitation, emergency shelter HousedRent housing unit in name Staying with family or friends")
13
Exhibit 6-4a: Sacramento HPRP Year 1, Living Arrangement the Night Before HPRP Program Entry, National Comparison Residence TypeSacramentoNational Total Already Homeless33.6%13.6% Place not meant for human habitation8.0%3.4% Emergency shelter25.6%10.2% Total from "Housing"63.9%81.8% Rented or owned housing unit45.4%66.4% Staying with family13.9%10.7% Staying with friend45.0%4.7% Total from Institutional Settings0.2%1.1% Psychiatric facility, substance abuse center or hospital0.0%0.5% Jail, prison, or juvenile detention0.0%0.4% Foster care home0.2%0.1% Total from Other Situation2.4%3.4% Hotel, motel (no voucher) or "other"2.4%3.4%
 or other 2.4%3.4%")
29
Exhibit 6-10: Destination of Persons Exiting HPRP by Program Type DestinationTotal Homeless Assistance Homelessne ss Prevention %% Permanent Housing Destination Living Independently Owned by Client1.2%0.4%1.5% Rental by Client91.6%86.6%93.3% PSH for Homeless Persons 0.1%0.4%0.0% With Family or Friends Living with Family, Permanent Tenure 0.0%0.1%0.0% Living with Friends, Permanent Tenure 0.2%0.1%0.2% % of Leavers in Permanent Housing 93.1%87.8%95.0% Other Housing Destinations Staying with Family or Friends, Temporary Tenure 2.0%0.4%3.6% Homeless1.8%5.8%0.4% Institutional Setting0.3%0.6%0.2% Other (Missing data, don't know, deceased) 2.8%5.4%1.9%
 2.8%5.4%1.9%")
34
HomelessPrev in PlacePrev Re HousingTotal HH HH #Average $HH #Average $HH#Average $HH#Average $ Rent Arrears5$469548$1,382186$1,377739$1,374 Rent Deposit729$60917$695601$7611,347$688 Utility Arrears116$335304$251208$289628$291 Utility Deposit76$16523$20064$214163$225 Monthly Rental Assistance 791 $566 553 $610 791 $598 2,135 $589 Total Rental Assistance $2,004$1,818$2,057$1,976 Total Utility Assistance0 $0.00 0 $0 1 $88 1 Total Financial Assistance 824$2,528576$3,222832$2,9032,232$2,847 Sacramento HPRP June 2011Direct Financial Assistance Provided by Program Type

35
Check-In After Exit Based on Phone and/or Mail Survey as of June 2011 – In Same Housing or Not? – Income Change? Households Reached at 3-months Homeless At EntryPrevention At Entry All Households #% of leavers #%#% 17123%25335%42437%

36
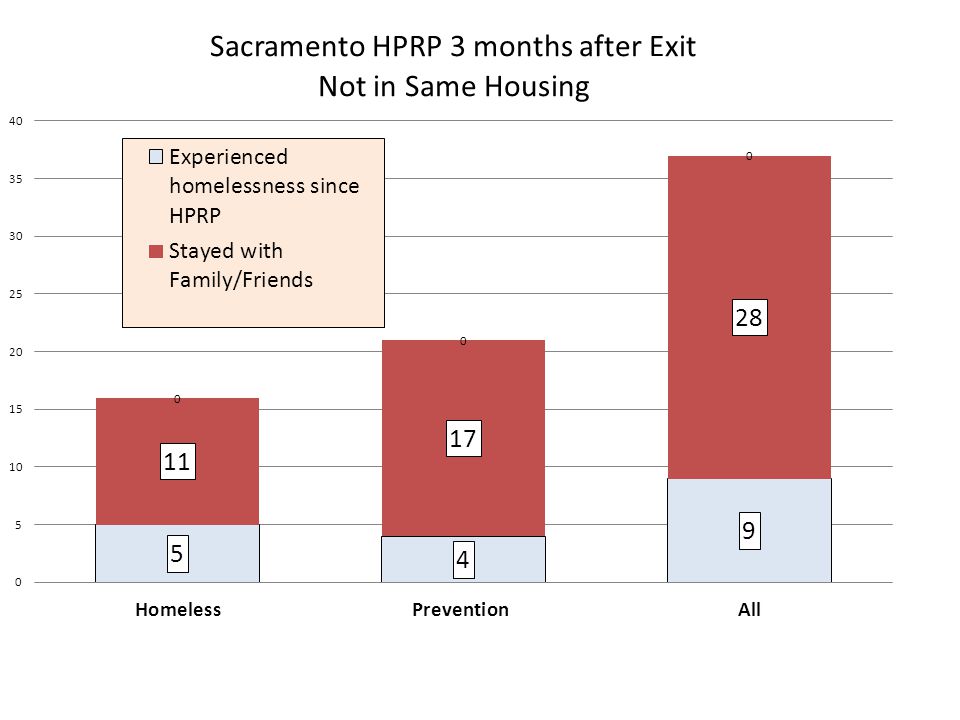
Homeless At Entry Prevention At Entry All Households In Same Housing 12875%20681%33479% Not in Same Housing 4325%4719%9021% Of Those Not in Same Housing Experienced Homelessness 53%42%9 Couch surfed 116%177%287% Prison or Jail 00%0 0 Total Experienced Unstable Housing 1621%218%379%

40
HMIS Returns to Homelessness Defined as either entry into HMIS after exiting HPRP or by self-report in follow up survey Household Type Total HH of Type Served Time After Exit% Returning to Homelessness All 20093 months.8% HH without Children5706 months4.2% HH With Children8956 months2.4% All HH10579 months4.5%

41
2011 Point-In-Time Count

Similar presentations


 Department of Community Development May 13, 2009.>")

, Housing Inventory Chart (HIC), and a Tool for Determining Unmet Need Utah State Community Services Office May 9, 2012.>")


 COUNT MORE SUCCESSFUL The Second Annual Nebraska-Western Iowa Symposium on Homelessness Homeless in the Heartland.>")


 NH Department of Health and Human Services.>")
 And VA Programs.>")


