Download presentation
Presentation is loading. Please wait.

1
Justin Glisan Iowa State University Department of Geological and Atmospheric Sciences RACM Project Update: ISU Atmospheric Modeling Component: Part 1 6th DOE/RACM Meeting: Boulder, CO 1Justin Glisan, Iowa State University

2
Outline Update since Santa Cruz CORDEX Production runs – Era-Interim Reanalysis – 1989 - 2007 – Arctic CORDEX Domain – Six member ensemble Observational Analysis of Extremes Spectral Nudging on the wr50a domain 2Justin Glisan, Iowa State University

3
Update since Santa Cruz Three inter-connected projects – CORDEX production runs – Observational analysis of extremes – Spectral nudging (Based on Matt Higgins work at CU) Running RACM CCSM12 on Pingo
 Running RACM CCSM12 on Pingo")
4
CORDEX Production Runs CU physics Era-Interim Reanalysis NSIDC sea ice 4Justin Glisan, Iowa State University

5
PAW on Arctic CORDEX WRFV3.1.0 w/ CU Physics Arctic CORDEX Domain Forcing data sets: – Era-Interim Reanalysis – NSIDC Bootstrap Fractional Sea Ice Six-member ensemble – One day stagger (01-06 January 1989) – January 1989 - December 2007 Justin Glisan, Iowa State University5
 – January December 2007 Justin Glisan, Iowa State University5")
6
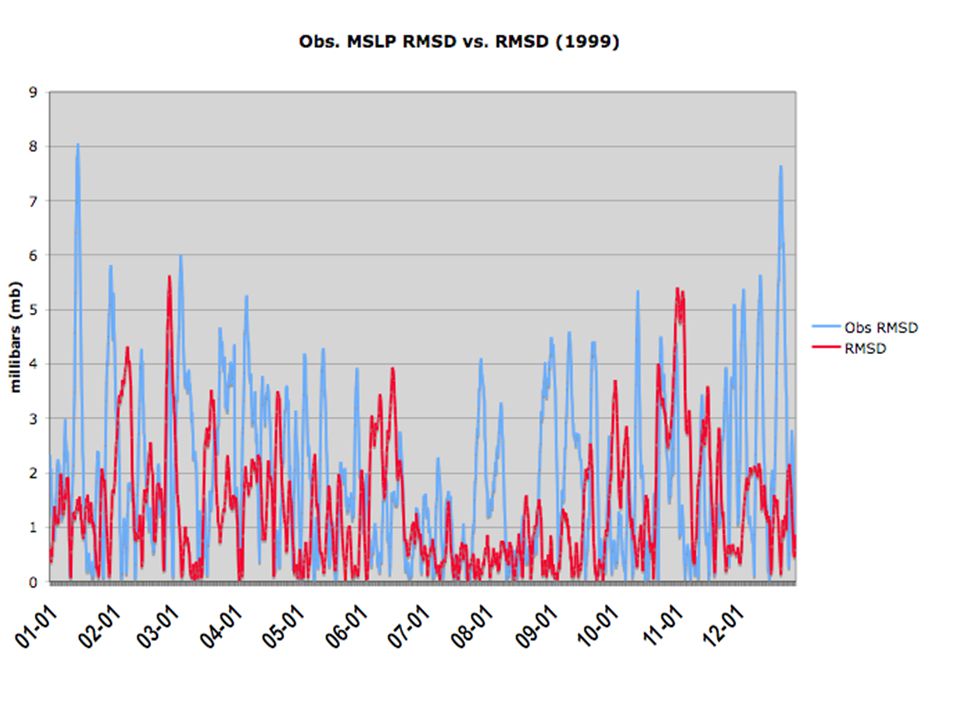
January 1999July 1999

8
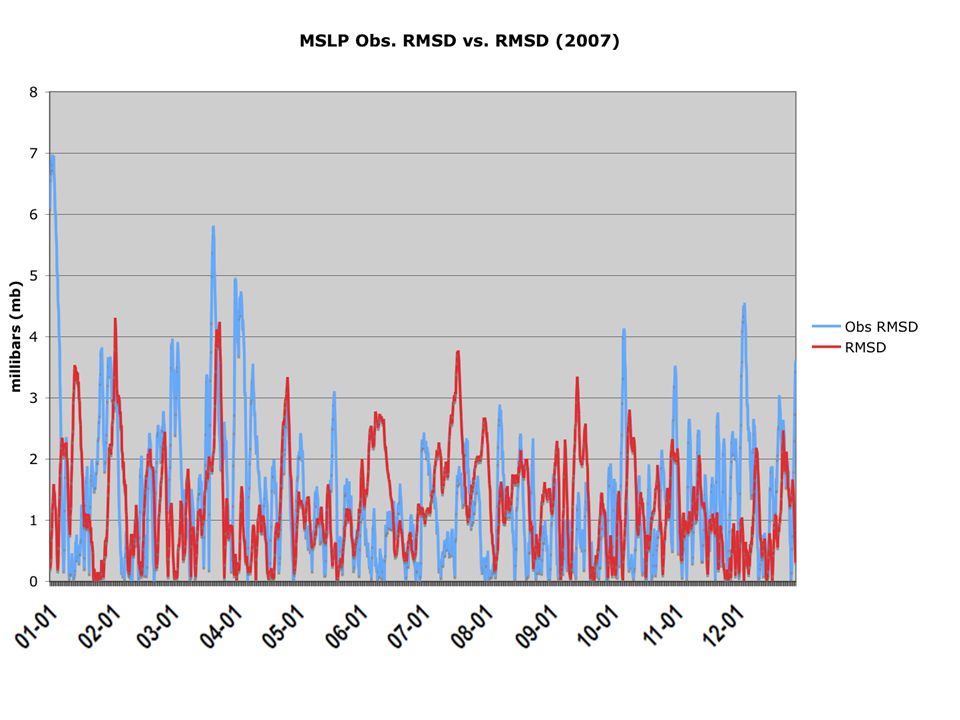
January 2007 July 2007

13
Obs. RMSD and Variability Reanalysis RMSD provides another measure of internal variability in the atmosphere Magnitudes of both RMSD curves correspond to a high degree, including the seasonal variability. Thus, the model versus reanalysis RMSD: May have a considerable dependence on unforced, quasi-random internal variability Also simulates the annual cycle of that variability

17
17Justin Glisan, Iowa State University Observational Analysis of Extremes North American stations Precipitation and Temperature

18
Domain of Interest Arctic CORDEX Domain (1989 - 2007) NCDS Global Summary of the Day – Around 150 stations – Precipitation and Temperature Four analysis boxes – Based on the climatological record, weather patterns – Physical location within the domain
 NCDS Global Summary of the Day – Around 150 stations – Precipitation and Temperature Four analysis boxes – Based on the climatological record, weather patterns – Physical location within the domain")
19
Each station is considered an individual realization within each box; hence each realization has a large number of samples, adding many degrees of freedom for statistical analysis. Observations are ordered and ranked by precipitation amount or temperature and then using the 95th percentile the extreme values are found using a suite of statistical programs. Further analysis is performed to determine extreme temporal and spatial regimes in temperature and precipitation.

21
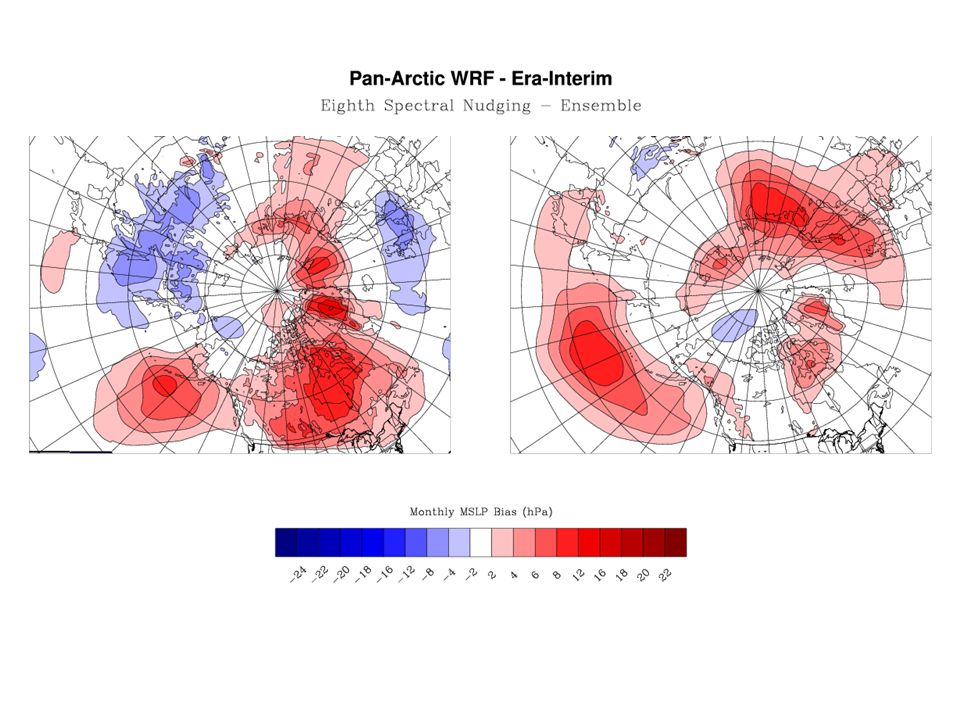
Spectral Nudging on wr50a Domain RACM Atmospheric Domain Four different nudging coefficients

22
PAW Setup on wr50a WRFV3.1.1 w/ CU physics Full spectral nudging option Three-member ensemble (one day stagger) Two cases: – Winter case: January 2007 (initialized in Dec.) – Summer case: July 2007 (initialized in June) Four nudging coefficients – Full (WRF default) – 1/2, 1/4, 1/8
 Two cases: – Winter case: January 2007 (initialized in Dec.) – Summer case: July 2007 (initialized in June) Four nudging coefficients – Full (WRF default) – 1/2, 1/4, 1/8")
31
ISU Polar WRF Brandon Fisel Iowa State University Department of Geological and Atmospheric Sciences RACM May 2010

32
Outline RACM May 2010 Motivations Model setup Short-term behavior Longer simulation results

33
Definitions RACM May 2010 BinaryFraction 00% - 49% 150% - 100%

34
Motivations RACM May 2010 WRF sea-ice: fraction v. binary Fractions ocean-atmosphere interactions dynamical behavior climatological behavior

35
2007, July Sea Ice RACM May 2010 July 2007 Large area, >50%

36
Model Setup RACM May 2010 Cordex domain 50-km res F; Fraction B; Binary B F/B B

37
Model Setup (cont…) RACM May 2010 Ensemble Taschetto et al. 8 members BC:6-hr; 12-hr sea ice 2 treatments fraction/binary

38
Simulations RACM May 2010 Init. ~1.5-2 weeks May 24, 2007 Target – June 6, 2007 sea-ice >50%

39
2-week Behavior RACM May 2010 Short-term 2 weeks May - June

40
RACM May 2010 2-week Behavior (cont…) F-B F-B(1-4) F-B(5-8) MSLP
 F-B F-B(1-4) F-B(5-8) MSLP")
41
MSLP Avg. RACM May 2010

42
MSLP Avg. (cont…) RACM May 2010
 RACM May 2010")
43
MSLP Avg. (cont…) RACM May 2010
 RACM May 2010")
44
MSLP Avg. (cont…) RACM May 2010
 RACM May 2010")
45
MSLP Avg. (cont…) RACM May 2010
 RACM May 2010")
46
MSLP Avg. (cont…) RACM May 2010
 RACM May 2010")
47
MSLP Avg. (cont…) RACM May 2010
 RACM May 2010")
48
August RACM May 2010

49
October RACM May 2010

50
Aug/Oct Differences RACM May 2010

51
October 2m-T RACM May 2010

52
Concluding Remarks RACM May 2010 August differences unforced bifurcation October differences low-level T differences occur along focus area significant?

53
Questions RACM May 2010

54
Daily Variance RACM May 2010

55
Daily Variance (cont…) RACM May 2010
 RACM May 2010")
56
ENS-Large RACM May 2010

57
ENS-Large (cont…) RACM May 2010
 RACM May 2010")
58
ENS-Large (cont…) RACM May 2010
 RACM May 2010")
59
ENS-Large (cont…) RACM May 2010
 RACM May 2010")
60
ENS-Large (cont…) RACM May 2010
 RACM May 2010")
Similar presentations


 Regional downscaling Regional modelling with HadGEM3-RA driven by HadGEM2-AO projections National Institute of Meteorological Research (NIMR)/KMA.>")


