Download presentation
Presentation is loading. Please wait.

1
Gender and Economics 2014 ECONOMIC EMPOWERMENT FELLOWS PROGRAM Maureen and Mike Mansfield Center The University of Montana Celia Winkler, J.D., Ph.D. Associate Professor Department of Sociology University of Montana celia.winkler@umontana.edu

2
Employment & Earnings Wage Gap Education Employment & Earnings

3
Wage Gap

6
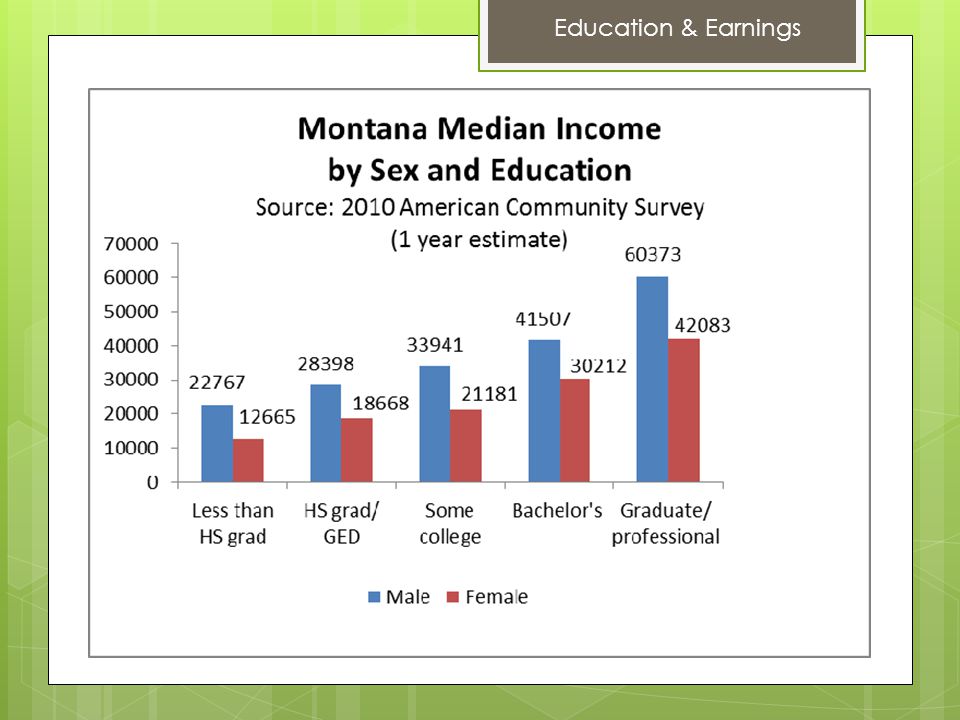
Education & Earnings

10
Working Labor Force Participation Job Clustering Child Care Labor Force Participation

14
Richland County

15
Labor Force Participation

16
Job Clustering

17
Child Care

18
Work Time

19
http://www.dailymail.co.uk/news/article-2487879/Women-work- harder-men-especially-Italy-11-hours-week.html

20
Poverty Individuals Children Retirement

21
Measuring Poverty In the U.S., the poverty threshold is a historical artifact, based on a 1964 study that found that households spent 1/3 of their income on food, on average. The 1964 poverty line was 3 times the cost of the “thrifty” food basket. Since then, it has been adjusted according to increases in the cost of living Several proposals to change this measure to take into account both differential costs and benefits available in various regions of the country.

22
Poverty Thresholds United States Poverty Thresholds 2013

23
½ Median: $13,499 Poverty Thresholds Poverty Line: $12,119

24
Extent of Poverty in the US, 1959 – 2009 Year % Poor Poverty Line (Family of 4) Median Income (Family of 4) Poverty Line as % of Median Income 195922.4%$2,973$6,97342.64% 196517.3 %$3,223$8,27938.93% 197012.6 %$3,968$11,17635.50% 197512.3%$5,500$15,84934.70% 198013.0 %$8,414$24,41034.47% 198514.0%$10,989$32,70333.60% 199013.5%$13,359$41,47332.21% 199513.8%$15,569$49,53131.43% 200013.3%$17,604$62,34928.46% 200512.5%$19,971$69,60528.69% 200914.3%$21,756$72,73329.91% 201115.0%$22,811$75,14830.35% Poverty Thresholds
 Median Income (Family of 4) Poverty Line as % of Median Income %$2,973$6, % %$3,223$8, % %$3,968$11, % %$5,500$15, % %$8,414$24, % %$10,989$32, % %$13,359$41, % %$15,569$49, % %$17,604$62, % %$19,971$69, % %$21,756$72, % %$22,811$75, % Poverty Thresholds")
25
Poverty: Individuals United States

26
Poverty: Individuals

27
Relative Poverty Rates among Women, mid-2000s Poverty: Women Janet C. Gornick and Markus Jäntti. 2010. “Women, Poverty, and Social Policy Regimes: A Cross-National Analysis.” LIS Working Paper No. 534.

28
Poverty: Individuals

30
Source: U.S. Census Bureau 2012, Small Area Income and Poverty Estimates

31
Poverty: Individuals

33
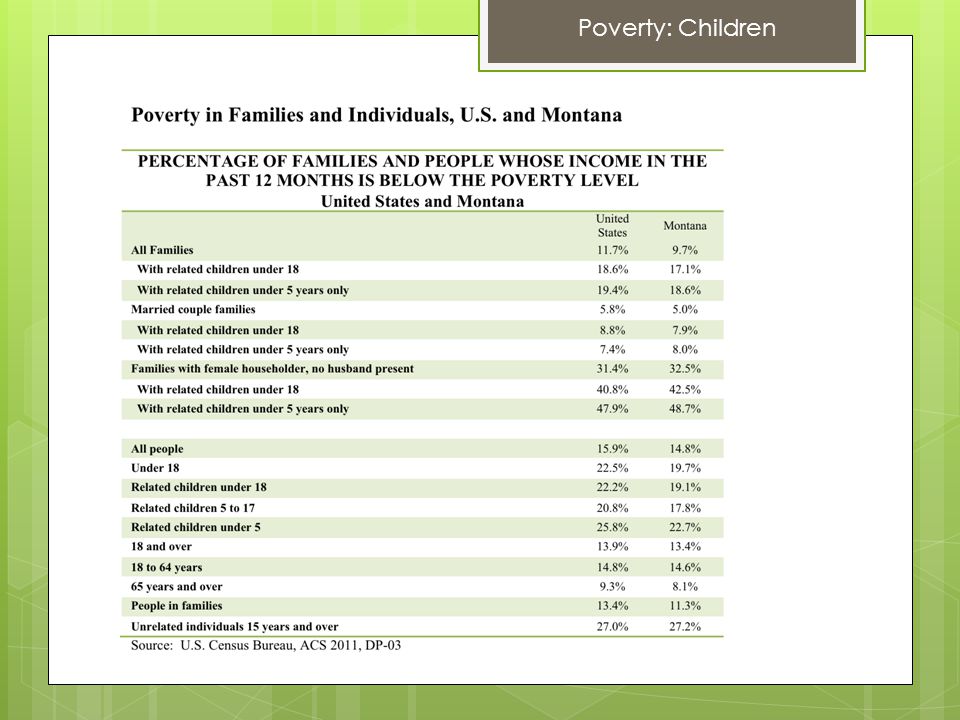
Poverty: Children

35
Poverty: United States

36
https://www.census.gov/hhes/www/poverty/data/historical/hstpov7.xls

Similar presentations