Download presentation
Presentation is loading. Please wait.

1
Project Management Concepts

2
What is a Project? Common Project Terms What does a Project Manager do? What’s in a Project? Project Management Processes Getting Started Planning a Project Executing the Plan Finishing the Project

3
A project is an activity that : ▪ is temporary having a start and end date ▪ is unique ▪ brings about change ▪ has unknown elements, which therefore create risk

4
Generally projects are formed to solve a problem or take advantage of an opportunity. Business as usual activities can often be mistaken for projects. Generally it is the uniqueness of the activity that is the deciding factor – do we do this every year? If so, then it is not truly a project – although you can use project methods to get it done. What is a project?

5
Building a deck Implementing a new system Mowing the lawn Planning a wedding Setting up a business Planning a student graduation YesNo

6
Deliverables: Tangible ‘things’ that the project produces Milestones: Dates by which major activities are performed. Tasks: Also called Actions. Activities undertaken during the project Risks: Potential problems that may arise Issues: Risks that have happened Gantt Chart: A specific type of chart showing time and tasks. Usually created by a Project Management program like MS Project. Stakeholder: Any person or group of people who may be affected by your project

7
Deliverables : A plan, a consent form, the deck Milestones: Tasks : tasksSubtasks Plan draftedRequirement gathered Best practice researched Draft 1 prepared Distributed to stakeholders Plan approvedFeedback gathered Amendments made Final plan prepared Distributed to stakeholders Sign-off obtained Plan drafted Plan approved 1 Dec 15 Dec Plan submitted Plan approved 16 Dec 15 Jan Materials purchased Resources booked Equipment identified Deck constructed Deck tested Deck quality approved “Deck warming” completed 16 Jan 19 Jan 23 Jan 24 Jan 28 Jan

8
Risks: Plan is not approved after first round of feedback Resources are not available at the required time Plan is not given consent For each of the above, you should have a contingency plan, or do some activity that may prevent it happening in the first place. Issues: If any of the above actually happens, then it becomes an issue to solve. Gantt Chart: Stakeholder: House owner, Builder, Council, ???

9
A person with a diverse set of skills – management, leadership, technical, conflict management, and customer relationship – who is responsible for: initiating, planning, executing, controlling, monitoring, and closing down a project.

10
Project Managers are essentially jugglers. They must make sure that everything keeps to task, that potential issues are quickly eliminated and the project is delivered on time, while making sure everyone knows what is happening and the project quality and budget are acceptable. Specifically they: direct all activities required to successfully meet the project objectives manage risk – scanning ahead for potential issues and resolving them before they become a problem solve problems - recommending alternative approaches to problems that arise and providing guidance to the Project Sponsor track and report project progress communicate to all stakeholders in the project

11
A project contains a well defined objective. The project objective is defined in terms of scope ( or requirements), schedule, and cost. A project is carried out via a set of interdependent tasks. A project uses various resources to carry out these tasks.
, schedule, and cost. A project is carried out via a set of interdependent tasks. A project uses various resources to carry out these tasks..")
12
Three critical drivers Scope (or requirement), cost, and time Trade-offs exist in any project against time and costs Time can only be reduced to a point Adding more people can create diseconomies of scale Increasing time may reduce or increase costs
, cost, and time Trade-offs exist in any project against time and costs Time can only be reduced to a point Adding more people can create diseconomies of scale Increasing time may reduce or increase costs")
13
A project has a definite start date and an expected completion date. The actual completion date may not always be the same as the expected date. A project is a one time or unique endeavor. A project has a customer. So why do projects fail? See later material!

14
A project has a degree of UNCERTAINTY. In project planning many assumptions are made regarding: ▪ access to resources. ▪ resource capability. ▪ impact of environmental factors. These assumptions are not always accurate.

15
We measure the success of a project using 4 major project constraints, specifically: Scope. Cost. Schedule (Time). Customer satisfaction (quality and performance).
. Customer satisfaction (quality and performance)..")
16
Project scope – Have all the project requirements (i.e., deliverables) been completed? Project cost – Is the cost of the project close to the amount the customer has agreed to pay? Schedule – Was the project completed on time? Customer satisfaction – Is the customer happy with the quality of the project?

17
The goal of a project is therefore: Complete the project scope within budget, time, and to the customer’s satisfaction. Examples of sources of project failure: The project manager underestimated the costs or resources required to complete the project. Uncertainties (e.g., weather, strikes, fire) may cause delays in the project. Customers may change requirements during the project. This is very common in software and new product development projects.
 may cause delays in the project. Customers may change requirements during the project. This is very common in software and new product development projects..")
18
WBS Hierarchy of tasks required to complete project Each task is broken into smaller tasks that can be managed and estimated Define task dependencies ▪ Some tasks must begin at the same time, some must end at the same time and some cannot start until the other tasks have finished. Estimate task durations and cost May be inputted into project management software

20
31.1% of projects will be cancelled before they ever get completed…. Over 50% of projects cost almost triple their original estimates. ▪ 1 million dollar project turns into a 3 million dollar project Estimate: ▪ in 1995 American companies and government agencies spent $81 billion for cancelled software projects. On the success side, the average is only 16.2% for software projects that are completed on-time and on-budget.

22
Things don’t always go according to plan critical people turnover, natural disasters, hiring freeze, technology change, new managements, competitors may make project more or less important Requires project managers to re-assess and trade- offs between requirements, costs, and time

23
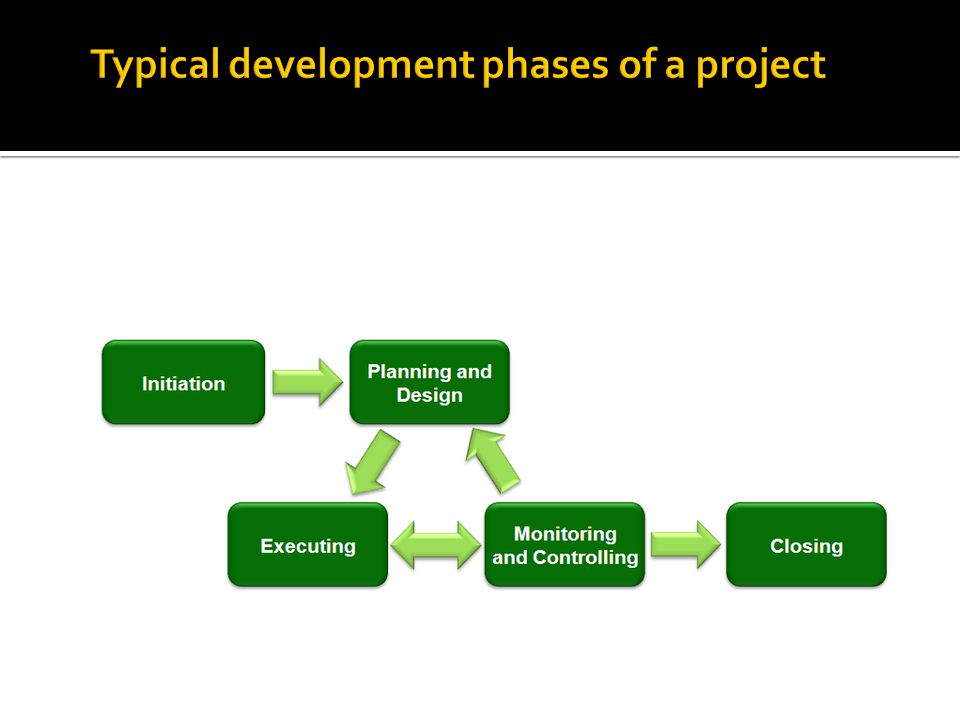
5 major phases of a project are: Identifying a need. Developing a proposed solution. Performing the project. Monitoring and control Terminating the project.

25
Project Management Demo

27
6 The first step in scheduling is to estimate how long each activity will take. The duration estimate is the total elapsed time for the work to be done PLUS any associated waiting time. The person responsible for performing the activity should help make the duration estimate.

28
7 It is necessary to select an estimated start time and a required completion time for the overall project.

29
8 A project schedule includes: the earliest times (or dates) at which each activity can start and finish, based on the project's estimated start time (or date) the latest times (or dates) by which each activity must start and finish in order to complete the project by its required completion time (or date)
 at which each activity can start and finish, based on the project s estimated start time (or date) the latest times (or dates) by which each activity must start and finish in order to complete the project by its required completion time (or date)")
30
9 Earliest start time (ES) is the earliest time at which a particular activity can begin. Earliest finish time (EF) is the earliest time by which a particular activity can be completed. EF – ES = Activity Duration Estimate
 is the earliest time by which a particular activity can be completed. EF – ES = Activity Duration Estimate.")
31
11 Latest start time (LS) is the latest time an activity must be started in order for the entire project to be completed by its completion time. Latest finish time (LF) is the latest time an activity must be finished in order for the entire project to be completed by its completion time. LF – LS = Activity Duration Estimate
 is the latest time an activity must be finished in order for the entire project to be completed by its completion time. LF – LS = Activity Duration Estimate.")
32
Slack or float is the amount of time that a task in a project network can be delayed without causing a delay to: subsequent tasks (free slack) project completion date (total slack)
 project completion date (total slack)")
33
Free slack ( or float): The free slack of an activity is the time this activity can be delayed without impact on the following activity. Total slack ( or float): The total slack of an activity is the time this activity can be delayed without impact on the finish date of the project.
: The total slack of an activity is the time this activity can be delayed without impact on the finish date of the project..")
34
An activity that has a total slack equal to zero is said to be a 'critical activity', which means that a delay in the finish time of this activity will cause the entire project to be delayed by the same amount of time.

35
14 If total slack is positive, it is the maximum time the activities on the path can be delayed. If total slack is negative, it is the amount of time the activities on the path must be accelerated.

37
15 The critical path is the longest path in the diagram. The activities that make up the critical path have the least slack.

38
16 Noncritical paths have positive values of total slack. Critical paths have zero or negative values of total slack.

39
Longest path through the network of activities Task dependencies compressed as much as possible Tasks may be moved to non-critical paths to shorten critical path If tasks on critical path run late, the project will be late.

41
Gantt Chart a simple bar chart that depicts project tasks against a calendar Program Evaluation and Review Technique (PERT) is a graphical network model that depicts a project’s tasks and the relationships between those tasks (Dependencies and Critical paths are found in PERT charts) Microsoft Project Most widely used project management software http://office.microsoft.com/en-us/project/default.aspx http://office.microsoft.com/en-us/project/default.aspx
 is a graphical network model that depicts a project’s tasks and the relationships between those tasks (Dependencies and Critical paths are found in PERT charts) Microsoft Project Most widely used project management software ")
43
Figure CE 18-5

45
Biggest challenge is scheduling Errors accumulate Difficult to do credible planning Every task may be on critical path ▪ MS Vista Operating system was delivered two years late. Was suppose to take 3 Y but took 5 Y ( 67% schedule overrun) ▪ Office 2003 was late. MS SQL server 2005 barely made it into 2005.
 ▪ Office 2003 was late. MS SQL server 2005 barely made it into")
46
Challenges Coordination ▪ Projects often organized into independent groups Diseconomies of scale ▪ Adding people increases coordination requirements Configuration control ▪ Changes must be carefully manages and monitored Unexpected events ▪ Chance of disruption due to unanticipated events

Similar presentations


Produce a network diagram based on the activities in a construction work b)Produce a network.>")


 In 1986 one well-known software engineer (Tom DeMarco) made the simple but important observation: “You.>")


