Download presentation
Presentation is loading. Please wait.

1
10 / 31 Outline Perception workshop groups Signal detection theory Scheduling meetings

2
Detection experiment Question –How sensitive is an observer to a sensory stimulus; for example, light?

3
Detection experiment Question –How sensitive is an observer to (for example) light? Classic experiment –Yes/No task

4
Detection experiment Question –How sensitive is an observer to (for example) light? Classic experiment –Yes/No task –Measure threshold intensity needed to have 50% hits

14
Threshold

18
Jane Nancy

19
Summary of results Thresholds –Jane = 20 –Nancy = 25

20
Summary of results Thresholds –Jane = 20 –Nancy = 25 False alarm rates –Jane = 51% –Nancy = 18.7%

21
Look at one intensity level I = 25

24
Jane’s Hit Rate P(H) =.84
 =.84")
25
Nancy’s Hit Rate P(H) =.5
 =.5")
26
Look at one intensity level I = 25 –Jane Hit rate: P(H) =.84
 =.84")
27
Look at one intensity level I = 25 –Jane Hit rate: P(H) =.84 False alarm rate: P(FA) =.51
 =.84 False alarm rate: P(FA) =.51")
28
Look at one intensity level I = 25 –Jane Hit rate: P(H) =.84 False alarm rate: P(FA) =.51 –Nancy Hit rate: P(H) =.5
 =.84 False alarm rate: P(FA) =.51 –Nancy Hit rate: P(H) =.5")
29
Look at one intensity level I = 25 –Jane Hit rate: P(H) =.84 False alarm rate: P(FA) =.51 –Nancy Hit rate: P(H) =.5 False alarm rate: P(FA) =.187
 =.84 False alarm rate: P(FA) =.51 –Nancy Hit rate: P(H) =.5 False alarm rate: P(FA) =.187")
30
Signal detection theory terms Hits - p(H) –Proportion of “yes” responses when signal is present
 –Proportion of yes responses when signal is present")
31
Signal detection theory terms Hits - p(H) –Proportion of “yes” responses when signal is present Misses - p(M) –Proportion of “no” responses when signal is present
 –Proportion of yes responses when signal is present Misses - p(M) –Proportion of no responses when signal is present")
32
Signal detection theory terms Hits - p(H) –Proportion of “yes” responses when signal is present Misses - p(M) –Proportion of “no” responses when signal is present False alarms - p(FA) –Proportion of “yes” responses when signal is not present
 –Proportion of yes responses when signal is present Misses - p(M) –Proportion of no responses when signal is present False alarms - p(FA) –Proportion of yes responses when signal is not present")
33
Signal detection theory terms Hits - p(H) –Proportion of “yes” responses when signal is present Misses - p(M) –Proportion of “no” responses when signal is present False alarms - p(FA) –Proportion of “yes” responses when signal is not present Correct rejections - p(CR) –Proportion of “no” responses when signal is not present
 –Proportion of yes responses when signal is present Misses - p(M) –Proportion of no responses when signal is present False alarms - p(FA) –Proportion of yes responses when signal is not present Correct rejections - p(CR) –Proportion of no responses when signal is not present")
34
Relationships between terms P(H) + P(M) = 1
 + P(M) = 1")
35
Relationships between terms P(H) + P(M) = 1 P(FA) + P(CR) = 1
 + P(M) = 1 P(FA) + P(CR) = 1")
36
Relationships between terms P(H) + P(M) = 1 P(FA) + P(CR) = 1 Only need to specify P(H) and P(FA)
 + P(M) = 1 P(FA) + P(CR) = 1 Only need to specify P(H) and P(FA)")
37
Extreme detection strategies Most liberal (always say yes)
")
38
Extreme detection strategies Most liberal (always say yes) –P(H) = 1, P(FA) = 1
 –P(H) = 1, P(FA) = 1")
39
Extreme detection strategies Most liberal (always say yes) –P(H) = 1, P(FA) = 1 Most conservative (always say no)
 –P(H) = 1, P(FA) = 1 Most conservative (always say no)")
40
Extreme detection strategies Most liberal (always say yes) –P(H) = 1, P(FA) = 1 Most conservative (always say no) –P(H) = 0, P(FA) = 0
 –P(H) = 1, P(FA) = 1 Most conservative (always say no) –P(H) = 0, P(FA) = 0")
41
Signal Detection Theory

42
Assume an internal measure of signal strength.

43
Signal Detection Theory Assume an internal measure of signal strength (X). –E.g. firing rate of ganglion cell

44
Signal Detection Theory Assume an internal measure of signal strength (X). –E.g. firing rate of ganglion cell X is corrupted by noise

45
Signal Detection Theory Assume an internal measure of signal strength (X). –E.g. firing rate of ganglion cell X is corrupted by noise –E.g. random variations in firing rate

46
Signal Detection Theory Assume an internal measure of signal strength (X). –E.g. firing rate of ganglion cell X is corrupted by noise –E.g. random variations in firing rate When signal is not present, X = X 0 + N

48
Signal Detection Theory Assume an internal measure of signal strength (X). –E.g. firing rate of ganglion cell X is corrupted by noise –E.g. random variations in firing rate When signal is not present, X = X 0 + N When signal is present, X = X S + N

50
o Firing rate when signal is present o Firing rate when signal is not present

51
Criterion Set a criterion level, C

52
Criterion Set a criterion level, C If X > C –Report a signal

53
Criterion Set a criterion level, C If X > C –Report a signal If X < C –Report no signal

54
o Firing rate when signal is present o Firing rate when signal is not present C=20, Liberal criterion

55
Liberal criterion = High hit rate

56
Liberal criterion = High false alarm rate

57
o Firing rate when signal is present o Firing rate when signal is not present C=30, Conservative criterion

58
Conservative criterion = Low hit rate

59
Conservative criterion = Low false alarm rate

60
Probability distribution on X (no signal)
")
61
Probability distribution on X (signal)
")
62
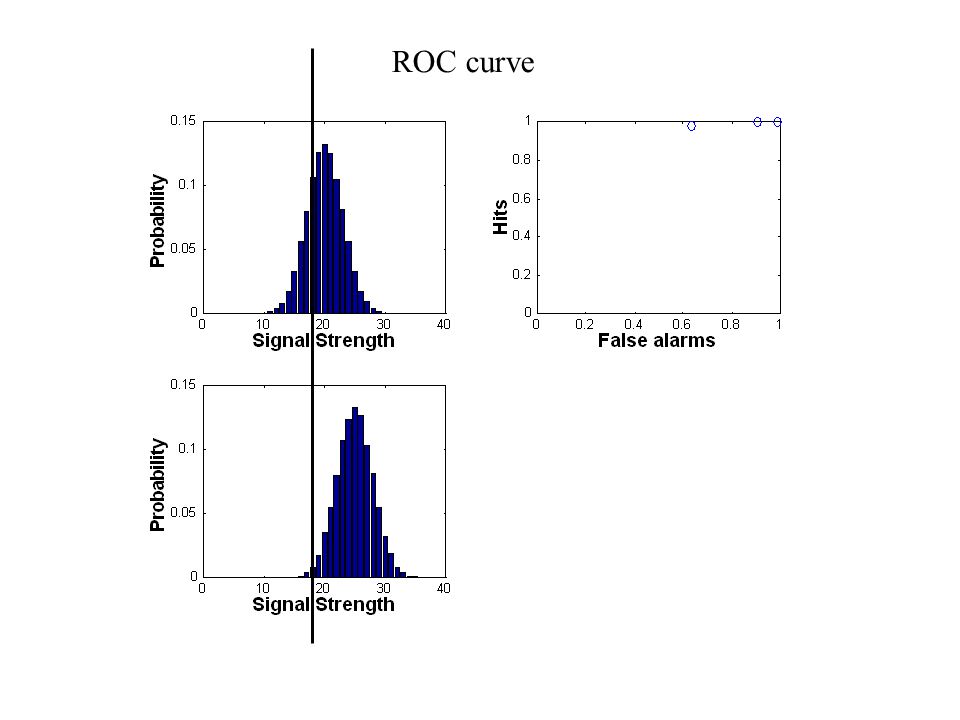
Liberal criterion

63
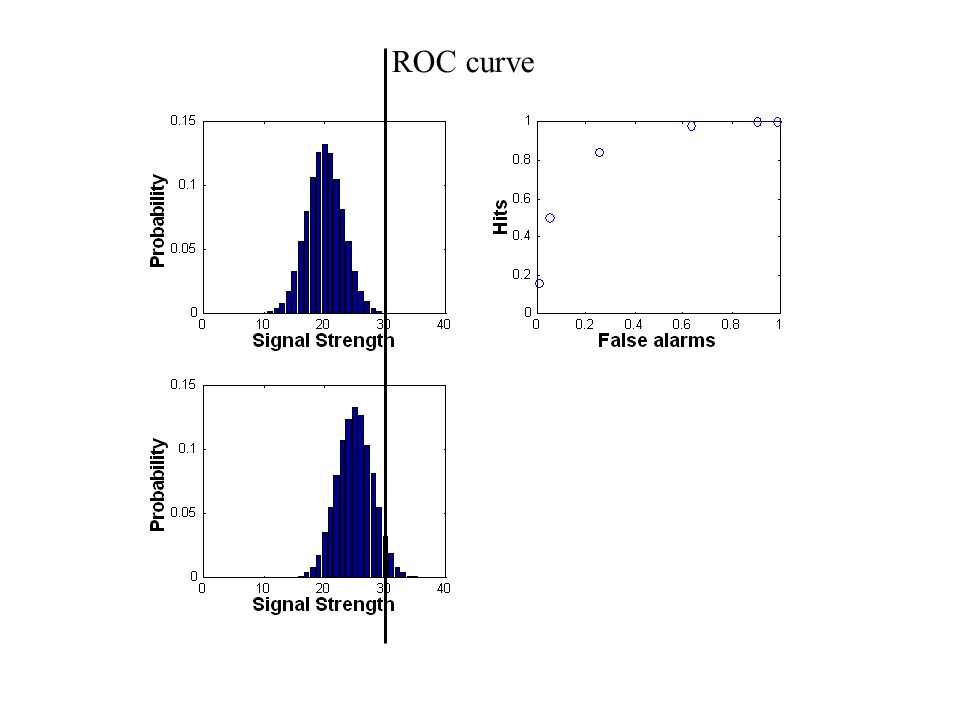
Conservative criterion

64
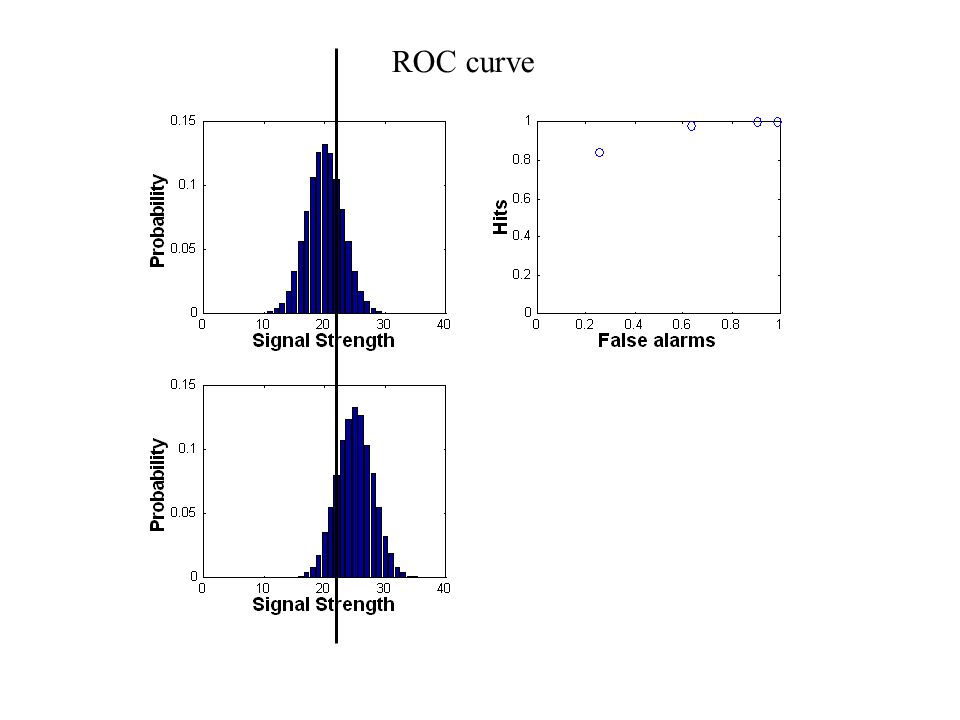
ROC curve

70
A B C No signal Signal

71
A B C

72
A B C

73
A B C No signal Signal

74
A B C

75
A B C

76
Determinants of performance No signal Signal

77
Determinants of performance XNXN XSXS No signal Signal

78
Determinants of performance XNXN XSXS ∆X No signal Signal

79
Determinants of performance XNXN XSXS 1. Difference in average strength of Signal measure ∆X = X S - X N ∆X No signal Signal

80
Determinants of performance 1. Difference in average strength of Signal measure ∆X = X S - X N 2. Amount of noise ∆X No signal Signal

81
Determinants of performance 1. Difference in average strength of Signal measure ∆X = X S - X N 2. Amount of noise 3. Sensitivity d’ = ∆X / ∆X No signal Signal

82
D’ determines which ROC curve your data will fall on

83
d’ =.83 d’ = 1.2 d’ = 2.5 D’ determines which ROC curve your data will fall on

84
Criterion determines where your data will sit on an ROC curve

85
Conservative criterion Liberal criterion Criterion determines where your data will sit on an ROC curve

87
Measuring sensitivity

88
Pick a stimulus level for a yes / no task

89
Measuring sensitivity Pick a stimulus level for a yes / no task Measure hit rate and false alarm rate

90
Measuring sensitivity Pick a stimulus level for a yes / no task Measure hit rate and false alarm rate Use p(H) and p(FA) to calculate d’
 and p(FA) to calculate d’")
91
Measuring sensitivity Pick a stimulus level for a yes / no task Measure hit rate and false alarm rate Use p(H) and p(FA) to calculate d’ d’ = absolute measure of sensitivity
 and p(FA) to calculate d’ d’ = absolute measure of sensitivity")
92
Blood test example Get a blood test for level of protein A.

93
Blood test example Get a blood test for level of protein A. Doctor says that test is positive for liver cancer.

94
Blood test example Get a blood test for level of protein A. Doctor says that test is positive for liver cancer. Doctor recommends surgery to collect tissue sample for biopsy.

95
Blood test example Get a blood test for level of protein A. Doctor says that test is positive for liver cancer. Doctor recommends surgery to collect tissue sample for biopsy. What should you ask the doctor about the blood test?

96
No cancer Cancer

97
Liberal criterion No cancer Cancer

98
Conservative criterion No cancer Cancer

Similar presentations


: Thresholds and Sensory Adaptation Mr. McCormick A.P. Psychology.>")

>")

![Bayes rule P[s(t)|x(t)] = P[x(t)|s(t)] P(s(t)] / P[x(t)] s(t) - incoming stimulus that describes the object x(t) – activity in the system resulting from.](/14/4220986/big_thumb.jpg "Bayes rule P[s(t)|x(t)] = P[x(t)|s(t)] P(s(t)] / P[x(t)] s(t) - incoming stimulus that describes the object x(t) – activity in the system resulting from.>")


 2 -- spatial.>")


