Download presentation
Presentation is loading. Please wait.

1
Zone design methods for epidemiological studies Samantha Cockings, David Martin Department of Geography University of Southampton, UK Thanks to: Arne Poulstrup, Henrik Hansen Medical Office of Health, Province of Vejle, Denmark s.cockings@soton.ac.uk

2
Why use areas? No choice - data only available for areas Confidentiality Cost Through choice Believe some phenomena are area-level Rates/ratios Visualisation/mapping Decision-making/planning

3
Modifiable areal unit problem (MAUP) Scale Aggregation Problems with using areas Relationships between variables which are observed at one level of aggregation may not hold at the individual, or any other, level of aggregation (Blalock, 1964) Relationships between variables which are observed at one level of aggregation may not hold at the individual, or any other, level of aggregation (Blalock, 1964) For a given set of data, different aggregations/zoning systems will often show apparently different spatial patterns in the data (Openshaw, 1984) For a given set of data, different aggregations/zoning systems will often show apparently different spatial patterns in the data (Openshaw, 1984) Ecological fallacy Small numbers/instability of rates Non-nesting units
 Scale Aggregation Problems with using areas Relationships between variables which are observed at one level of aggregation may not hold at the individual, or any other, level of aggregation (Blalock, 1964) Relationships between variables which are observed at one level of aggregation may not hold at the individual, or any other, level of aggregation (Blalock, 1964) For a given set of data, different aggregations/zoning systems will often show apparently different spatial patterns in the data (Openshaw, 1984) For a given set of data, different aggregations/zoning systems will often show apparently different spatial patterns in the data (Openshaw, 1984) Ecological fallacy Small numbers/instability of rates Non-nesting units")
4
Recent developments in (UK) automated zone design methods/tools 2001 UK Census of Population Automated design of Output Areas (OAs) Martin et al (2001) 1 ; Martin (2002) 2 Based on Automated Zoning Procedure (AZP) Openshaw (1977) 3 ; Openshaw & Rao (1995) 4 Automated Zone Matching software (AZM) Martin (2002) 5 1 Environment & Planning A, 33, 1949-1962 3 Transactions of the IBG, NS, 2, 459-472 2 Population Trends 108, 7-15 4 Environment & Planning A, 27, 425-446 5 IJGIS, 17, 181-196
 automated zone design methods/tools 2001 UK Census of Population Automated design of Output Areas (OAs) Martin et al (2001) 1 ; Martin (2002) 2 Based on Automated Zoning Procedure (AZP) Openshaw (1977) 3 ; Openshaw & Rao (1995) 4 Automated Zone Matching software (AZM) Martin (2002) 5 1 Environment & Planning A, 33, Transactions of the IBG, NS, 2, Population Trends 108, Environment & Planning A, 27, IJGIS, 17,")
5
Methods Building blocks Aggregated zones Initial random aggregation Iterative recombination Maximise objective function Martin, D (2002), Population Trends, 108, p.11 Automated zone design … iterative recombination
, Population Trends, 108, p.11 Automated zone design … iterative recombination")
6
How can automated zone design help in environment and health studies? Explore sensitivity of results to MAUP Design sets of ‘optimal’ purpose-specific zones Stability of estimates Zones of homogeneous population size? Exploring spatial patterning of disease Zones of homogeneous rates? Analysing relationships between variables Zones of homogeneous risk/confounding factors? Barriers/boundaries Zones constrained by geog. features or admin. boundaries

7
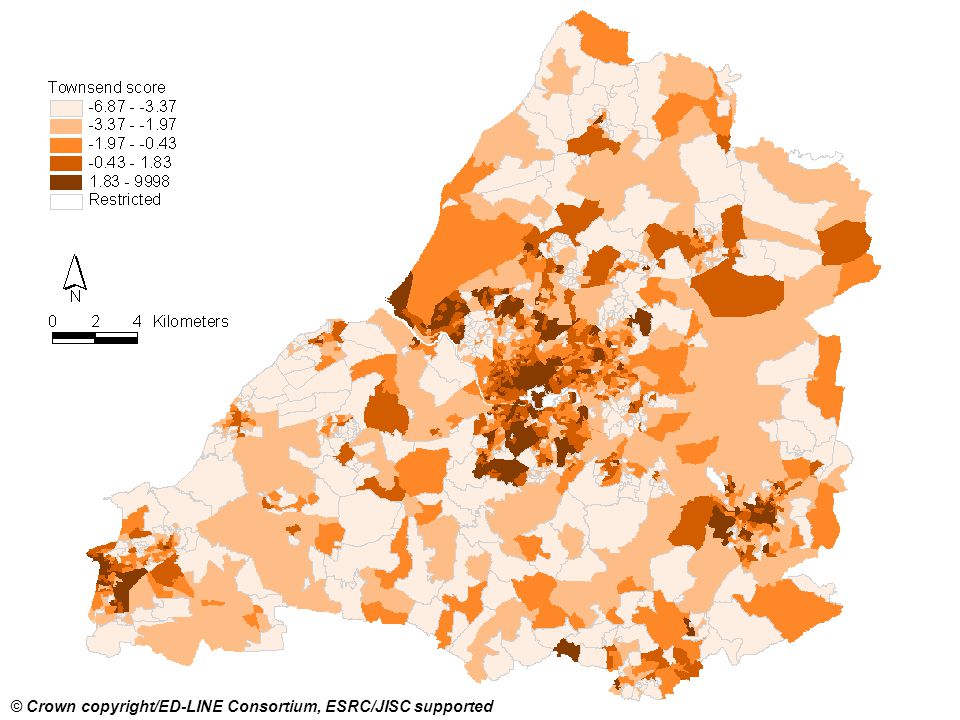
Empirical study 1: Pre-aggregated data Morbidity and deprivation in SW England County of Avon (1991 Census) 1970 enumeration districts 177 wards Premature (0-64 years) limiting long term illness (LLTI) Townsend deprivation score Standardisation to England & Wales
 1970 enumeration districts 177 wards Premature (0-64 years) limiting long term illness (LLTI) Townsend deprivation score Standardisation to England & Wales")
8
© Crown copyright/ED-LINE Consortium, ESRC/JISC supported

12
Aims Explore sensitivity of association at different scales (population size) Explore sensitivity of association for different aggregations at a given scale Explore ‘robustness’ of ED and ward level zoning systems for this type of spatial analysis
 Explore sensitivity of association for different aggregations at a given scale Explore ‘robustness’ of ED and ward level zoning systems for this type of spatial analysis")
13
AZM software ©David Martin

14
target 3250; mean 0-64 pop. 3713 © Crown copyright/ED-LINE Consortium, ESRC/JISC supported

16
Correlation (Townsend score and LLTI SMR) against mean pop. size … the scale effect EDs Wards
 against mean pop. size … the scale effect EDs Wards")
17
Standard deviation (pop. 0-64) against mean pop. size … the scale effect EDs Wards
 against mean pop. size … the scale effect EDs Wards")
18
Correlation (LLTI-Townsend) vs. mean population size at given scale … the aggregation effect
 vs. mean population size at given scale … the aggregation effect")
19
Results Observed association affected by choice of zoning system – MAUP/ecological fallacy Automated zoning systems demonstrating greater stability of population size, higher correlations Generally increasing Townsend-LLTI correlation with increasing zone size (pop.) and iterations ED and ward correlations at low end of variation at given scale Neighbourhood scale of ~3000 for UK?
 and iterations ED and ward correlations at low end of variation at given scale Neighbourhood scale of ~3000 for UK")
20
Empirical study 2: Individual level data Dioxins and cancer, Kolding, Denmark Background c.50,000 residents Airborne carcinogenic dioxin Data Geo-referenced addresses of residents 1986-2002 Roads, rivers, lakes Buildings/urban areas

21
Possible zone design criteria Population size: threshold/target Physical boundaries Roads, rivers, lakes Shape Homogeneity Built environment - dwelling type, tenure Socio-economic - education, income, occupation

23
Methods: Thiessen polygons around addresses

24
Methods: Using constraining features – roads and rivers

25
Methods: Clipped thiessen polygons

26
Illustrative zoning system from AZM: target 300, threshold 250

27
Next steps Other design constraints Physical boundaries in zone design process Homogeneity Built environment Social environment Use zones to calculate rates of cancer Sensitivity analysis

28
Conclusions All zoning systems are imposed and should not be considered neutral or stable Zone design methods offer: The ability to explore the sensitivity and robustness of existing and alternative zoning systems The ability to design purpose-specific zoning systems according to pre-defined criteria

29
Predisposing: age, sex, ethnicity, genetics, birthweight Lifestyle: smoking, diet, exercise, alcohol Socio-economic: occupation, income, education Environment and health studies: What are we trying to model? Pollution: air, water, noise ‘Neighbourhood’: services, housing type/quality, ethnic groupings/population mixing, deprivation, crime, support networks ‘People’/‘Composition’ ‘Place’/’Context’ People Risk factors Health Outcome Area levelIndividual level Confounding factors Points? Areas? Points? Points/areas?

30
Standard deviation (0-64) vs. mean population size for different aggregations at a given scale
 vs. mean population size for different aggregations at a given scale")
Similar presentations


 & ArcView GIS software? What is a Geographical Information System (GIS)? Introduction to ESRI ArcView 3.x.>")


 Seraphim Alvanides (University.>")

