Download presentation
Presentation is loading. Please wait.

1
Responding to changes in demand

2
Some Stats + 55,000 homes 170 local authorities – 2/3ds in just 10 LAs Around 70%, general needs for rent In 6 geographic Divisions + 10k bed spaces of housing with care/support Riverside Home Ownership: LCHO, leaseholders Commercial companies: Prospect and Compendium

3
Across the country, we face mostly of the same issues as you

4
National population rising by c 10m over next 25 years +2.2m household growth next 10 years +200k new homes per year Demographics

5
Uneven distribution between regions

6
Uneven distribution within regions Household growth projections to 2021 Cambridge (-3%) and East Cambridgeshire (+23%) Liverpool (+1%) and Warrington (+12%) City of London (+58%), Tower Hamlets (+32%)
 and East Cambridgeshire (+23%) Liverpool (+1%) and Warrington (+12%) City of London (+58%), Tower Hamlets (+32%)")
7
…and nature of ‘growth’ very different London and SE, driven by net inward migration (from within and outside UK) and birth rate In parts of the North, driven by ageing population and out migration
 and birth rate In parts of the North, driven by ageing population and out migration")
10
All of this equals increasing dependency

11
Household composition changing too Average household size continues to decline: 2.36 – 2.33 over next 10 years But, new phenomena –Young people moving back home, delaying household formation –Shared housing, driven by affordability/benefits What was the fastest growing household type in the decade to 2013? Households with 2+ families (+40%)
.")
12
Smallest dwelling sizes in Europe Up to half of homes smaller than 2010 London Design Guide Standard Choice

14
2008 – 13 Earnings increased by 109% Social rents by 116% Riverside rents by 122% Pre-payment gas by 165% Rents capped at 80% of local market Affordability

15
“We are supporting investment to develop a high-quality, professionally managed private rented sector. Our £1 billion Build to Rent fund is on track to deliver up to 10,000 houses for rent. We are committed to promoting a sustainable private rented sector, which is why this summer we will publish a model tenancy agreement, giving landlords and tenants the choice to agree longer-term fixed tenancies.” - Kris Hopkins, Housing Minister, June 2014

16
Riverside on Merseyside 3500 sheltered and supported 20,000 General needs - Includes 8500 stock transfer 15% <25 years old - 25% c50 years old - 60% 85 - 110 years old 70% houses / 30% flats 30% 1 bed - 20% 2 bed - 50% >3 bed 8 out of 10 properties in 10% most deprived neighbourhoods nationally 10% annual turnover - 2000 voids per year – average £3K each 75,000 repairs per year 40% under-occupy – 10% overcrowded >50% limiting health / disability Only 25% in work

17
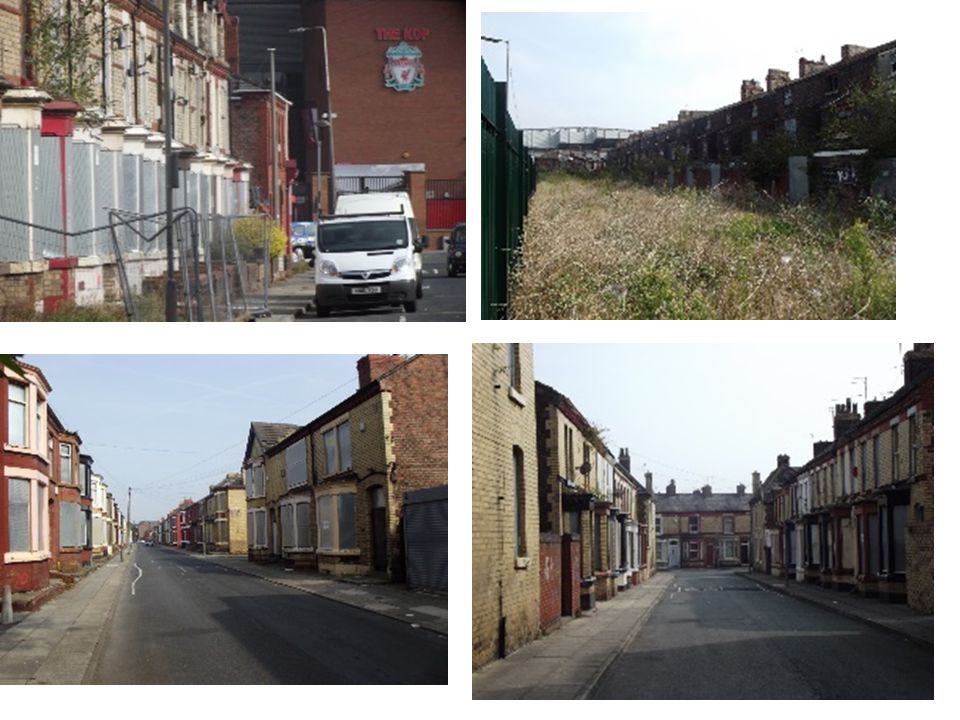
More applications from singles, younger, lone parents Wanting 2 Bedrooms but space standards matter – gardens / play area As do local amenities, schools, shops, transport etc. Houses rather than flats – rejecting 3 bedroom offers – bedroom tax Elderly want bungalows – extra care schemes Hopscotch between social landlords Rejecting Victorian terraced or converted Victorian Villa flats Service Charges prohibitive – affordability issues increasing – PL’s competing Difficult to let Rural units Some Demand Issues

18
Some Local Initiatives Can we stop them leaving? Affordable warmth, debt counselling, welfare benefit advice Anti-social behaviour – victim centred / Hate Crime Disability adaptations Referrals to other agencies, DV, Education welfare, Health etc Livetime – elderly outreach Springboard – employment support / apprenticeships Volunteering - Community initiatives Environmental services – gardens…. Programmes of Customer Care Visits – (CCVs) and Property MOTs
 and Property MOTs.")
19
A 4 Year Programme of Proactive Maintenance Designed to reduce post-MOT repair reporting

20
The full 4 Year Programme

21
Month of MOT Year of MOT Month of Post MOT Repair Type of Repair Price

22
Month Year Month of post Type of Repair Price of MOT of MOT MOT Repair

23
Month Year Month of post Type of Repair Price of MOT of MOT MOT Repair

24
Month Year Month of post Type of Repair Price of MOT of MOT MOT Repair

25
Month of post Type of Repair Price MOT Repair of Repair Drains Elecs Rainwater Bathroom

26
Initiatives continued…….. Getting them Let… Marketing Zoopla, Gumtree, ‘Recommend a Friend’, Riverside Web-site, Local Media, Local Offices, Local shops, Twitter, CBL … Allocations – Local Lettings initiatives Furnished tenancies – wholly or partial Homes for Heroes Customised security packages on voids Partnership working LA/Councillors PSG (problem solving groups) – abandoned properties, PL enforcement, environmental, ASB – Police…. Same Day Lets
 – abandoned properties, PL enforcement, environmental, ASB – Police…. Same Day Lets.")
29
The birth of YouRplace Neighbourhood Services 16 Wardens – 28 Environmental Rangers

30
Neighbourhood Management – clean streets

31
Neighbourhood tool: NIS

32
Property tool: HFAT

33
Formerly 58 units student accommodation void for 7 years Converted to 58 extra-care elderly apartments

34
Long-term voids – no demand Converted for sale

35
The Brownstone Initiative Long term low demand flats Based on NY ‘Homeworks’ Programme Convert to 3 units for sale to one midfdle income buyer – rents out 2 units and must live in third. Creates residential stakeholder landlords

36
Our property, next to and damaged by Private Landlord Long-term void – 12 years Purchased private building at auction Converted to 9 apartments for rent

39
Responding to changes in demand

Similar presentations


 MBA CIM DipM.>")


