Download presentation
Presentation is loading. Please wait.

1
Distributing the Benefits and Burdens of Growth: Metropolitan Equity in the Portland Region

2
Sprawl, Segregation, Growth and Fiscal Equity in the Portland Metropolitan Area

3
Regional institutions like Portland Metro can help to mitigate the effects of local government fragmentation by coordinating land use, transportation, housing and environmental policy on a metropolitan scale.

4
Portland and the Twin Cities have the strongest regional governance institutions in the country. Their performance on various indicators of social and economic health reflects this.

5
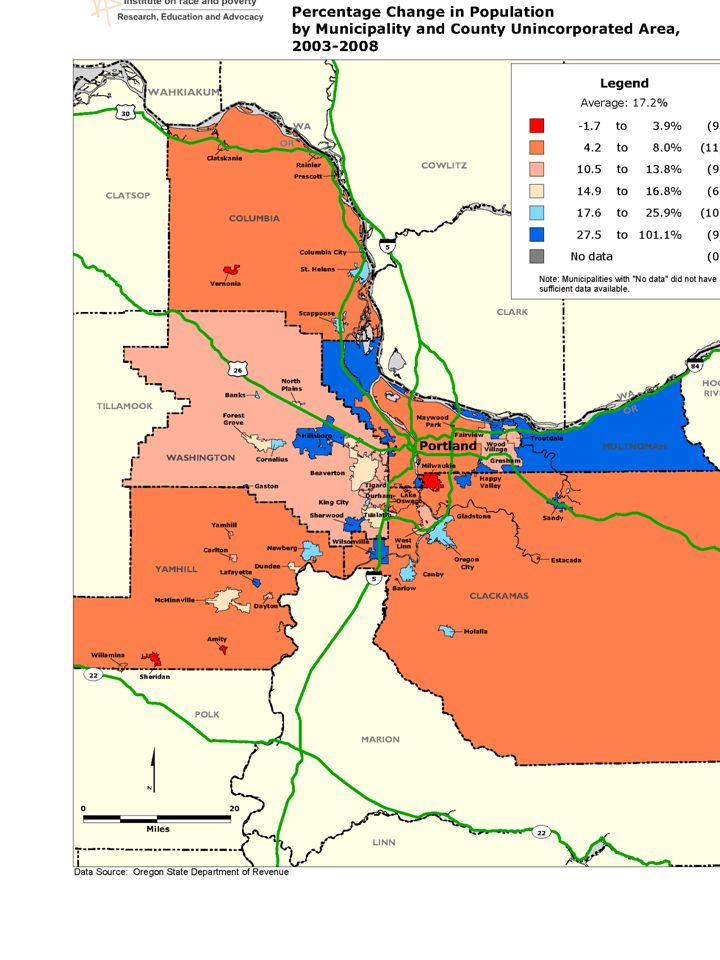
Sprawl Portland sprawled less than expected between 1970 and 2000 (given its degree of local government fragmentation).
.")
6
The amount of urbanized land in the region actually grew less rapidly than population, making it one of only four metropolitan areas among the 25 largest where this was true.

9
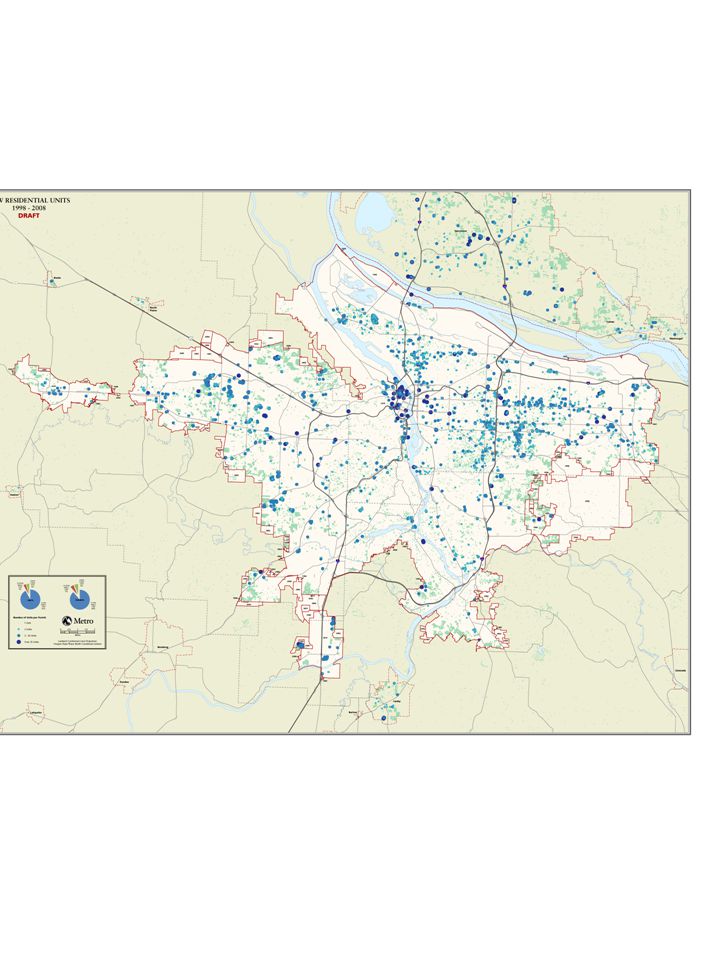
Recent growth remains relatively balanced with the highest growth rates occurring (for the most part) in already- developed incorporated areas.
 in already- developed incorporated areas.")
11
The region is well- known for coordinating new housing with targeted growth corridors determined by the region’s urban growth boundary (UGB) and transportation infrastructure.
 and transportation infrastructure.")
14
However, Measures 37 and 49 have threatened this record. Existing Measure 37 claims outside the region’s UGB could, if acted upon, lead to much more sprawling development than the region has seen in the past.

15
Measure 37 Claims

16
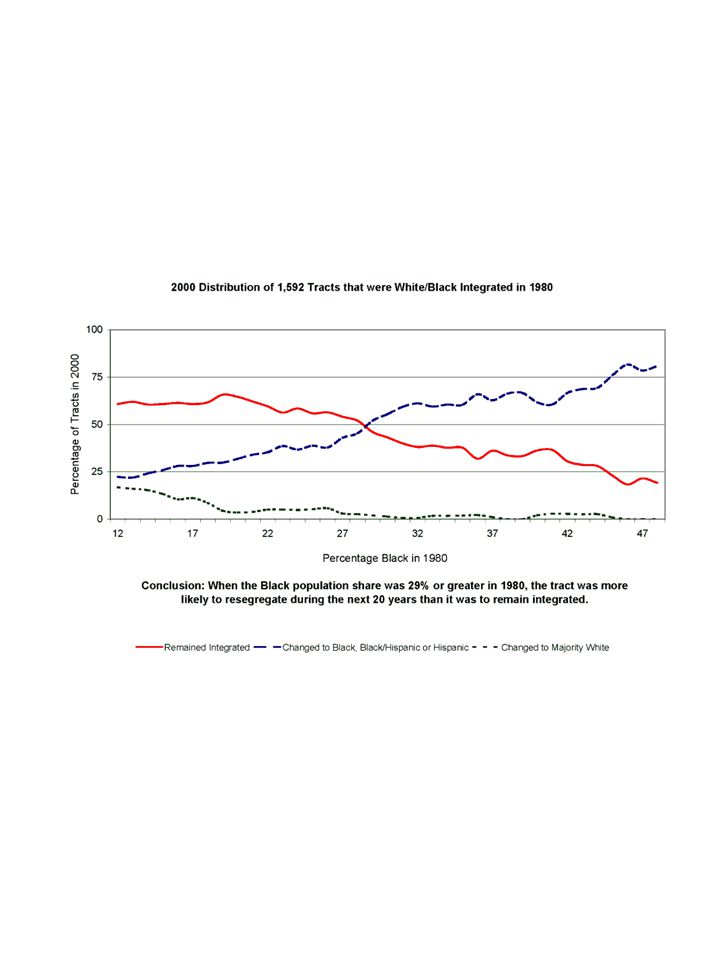
Segregation The region was less segregated in 2000 than expected, given its degree of local government fragmentation.

18
However, more current data for schools shows that the region’s schools are becoming more and more segregated by race and income.

21
The number of non- white segregated schools is increasing rapidly. In 1998, there were only 14 elementary schools in the 5-county region with non-white shares above 50 percent. Just 10 years later, in 2008, the number was 67. More than half (36) were in the suburbs
 were in the suburbs.")
22
Similarly, there were only 5 elementary schools in the 5-county region with non-white shares above 67 percent in 1998. Just 10 years later, in 2008, the number was 32. 13 were in the suburbs.

23
More than a quarter of elementary schools open in both 1998 and 2008 experienced an increase of more than 25 percentage points in the share of non-white students. Most were in the suburbs.

24
Non-white segregated schools are among the poorest schools in the region. 56 of the 67 schools with non-white shares above 50 percent also had poverty rates above 50 percent.

25
51 of the 65 schools going through rapid racial transition (non- white share increases of more than 25 percentage points) had poverty rates above 50 percent.
 had poverty rates above 50 percent.")
28
Research shows that high- poverty, segregated schools undermine opportunity for their students in many ways, including: Lower test scores Higher dropout rates Lower college attendance rates Lower earnings later in life Greater risk of being poor as adults

29
Research also shows the academic and social benefits of integrated schools for students of all races, including: Greater academic achievement Higher expectations Narrower inter-racial achievement gaps Greater cultural competence, preparing students of all races for our increasingly diverse workforce and society

31
Affordable housing policies can be used to provide greater educational opportunities for poor kids and children of color, while also promoting more integrated neighborhoods.

34
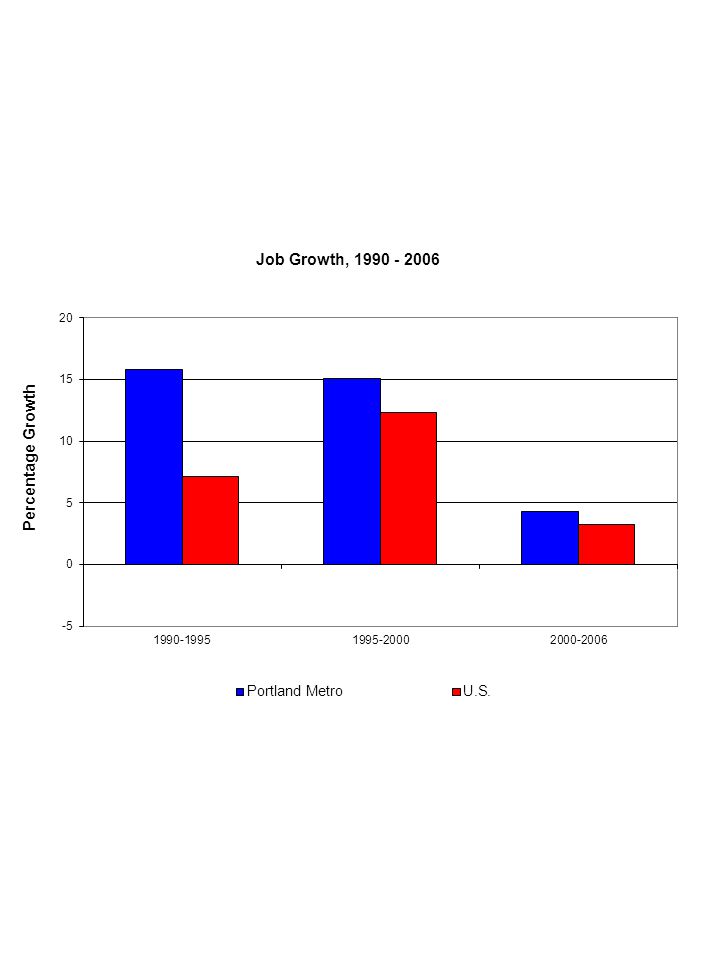
Job Growth The region has grown more rapidly than expected givens its degree of local government fragmentation.

36
And job growth has been relatively balanced between urban and suburban locations, with relatively dense job centers capturing much of the growth.

38
However, the region’s growth advantage relative to the rest of the country is narrowing. Regional growth was 9 points greater between 1990 and 1995, but only 1 point greater between 2000 and 2006.

40
Fiscal Equity Local tax base was distributed more equally across the region than expected given its degree of local government fragmentation.

42
Unlike many metropolitan areas, the fully developed core of the region shows tax bases and growth roughly commensurate with most suburban areas.

45
Regional Policy-making for the future: Segregation Segregation in schools and neighborhoods are closely related. Neighborhood characteristics shape schools and school characteristics factor into neighborhood choices by parents. School transitions can accelerate neighborhood transition; stably integrated schools can help stabilize neighborhoods.

48
Regional/statewide approaches to school and neighborhood integration: Financial incentives to school districts Intra-district choice—e.g. magnets Inter-district choice—e.g. Choice is Yours Program Multi-district collaborations Targeting LIHTC, Section 8 and other affordable housing programs in pro-integrative ways

49
Regional Policy-making for the future: Fiscal Equity Regional tax-base sharing systems like the Fiscal Disparities Program in the Twin Cities: Place a portion of growth in tax base into a regional pool Distribute the tax base back to participating municipalities and school districts based on tax base, population or other local characteristics

50
Reduces incentives for inefficient competition for tax base (the “ratables chase”) Encourages joint economic development efforts, enhancing long-run regional growth Complements regional land-use planning Provides insurance against future changes in growth patterns – few parts of a region can count on being a regional growth leader forever Reduces inequalities in tax rates and services Tax Base Sharing:
 Encourages joint economic development efforts, enhancing long-run regional growth Complements regional land-use planning Provides insurance against future changes in growth patterns – few parts of a region can count on being a regional growth leader forever Reduces inequalities in tax rates and services Tax Base Sharing:")
51
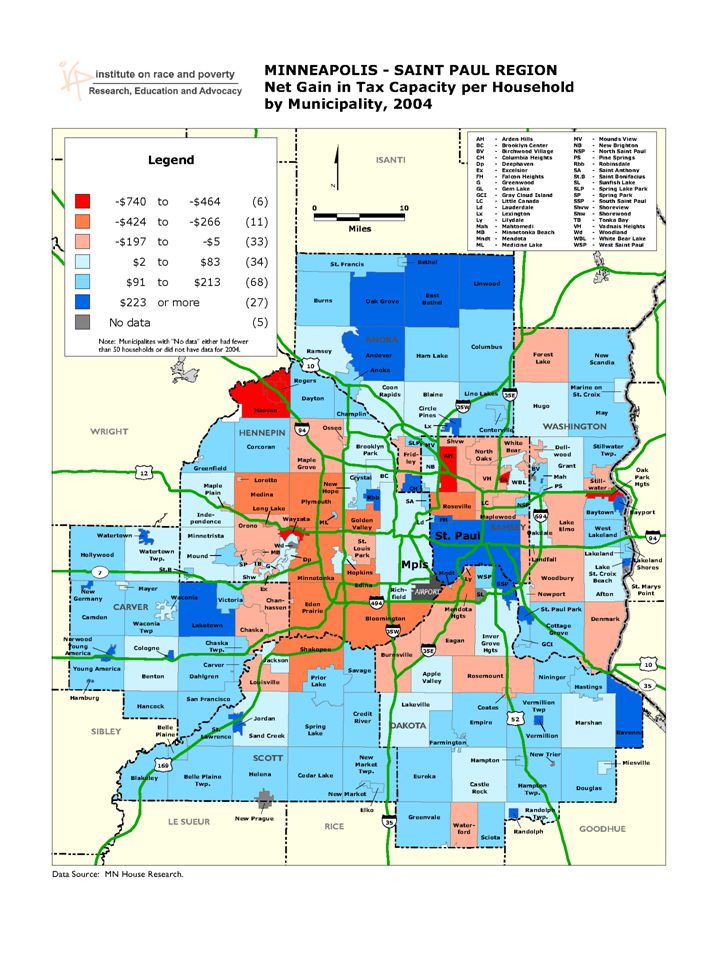
Each year, each location contributes 40% of the growth in its commercial- industrial tax base to a regional pool. Tax-base in the pool is then be re- distributed back to each location based on total local tax base and population. The re-distributed tax-base is then taxed by each location at its own tax rate. The program covers the seven core Minnesota counties in the Twin Cities Metropolitan Area. It benefits most residents. In 2004, 64% of households in the region lived in areas that received more from the pool than they contributed. Twin Cities Fiscal Disparities Program

52
In 2004, 32% of regional commercial- industrial tax base and 10% of total tax base was in the pool. In St. Paul, one of the largest beneficiaries, the average homestead tax was 8.8% lower than it would have been without Fiscal Disparities. Minneapolis has had periods where it contributes and other when it benefits. Twin Cities Fiscal Disparities Program

53
Reduces overall property tax base inequality in the region by about 20% (as measured by the Gini coefficient). Reduces the ratio of the highest to lowest tax base per household from 25 to 8. Reduces the ratio of the second highest to second lowest tax base per household from 10 to 4. Twin Cities Fiscal Disparities Program

55
Regional Policy-making for the future: Land Use Planning Strategic use of the UGB expansions to complement other policy objectives, such as targeting to communities pursuing pro-integrative school or neighborhood policies

56
Set measurable performance standards for Portland Metro. Growth in urbanized land compared to population growth. Segregation in schools; racial transition in schools. Job growth compared to other large metros. Fiscal inequality (Gini coefficient for local tax base per capita) Percentage of affordable housing in high-opportunity communities. Regional Policy-making for the future: Accountability
 Percentage of affordable housing in high-opportunity communities. Regional Policy-making for the future: Accountability.")
57
Contact Us: http://www.irpumn.org

Similar presentations


 2.Low tax base suburb (10-15% of the pop.) 3.High tax base suburb (never.>")