Download presentation
Presentation is loading. Please wait.

1
Big Idea 1 - Evolution E.U. 1a – Change in the genetic makeup of a population over time is evolution 1a1 – Natural selection is a major mechanism of evolution 1a2 – Natural selection acts on phenotypic variation in populations 1a3 – Evolutionary change is also driven by random processes 1a4 – Biological evolution is supported by scientific evidence from many disciplines, including mathematics.

2
Big Idea 2 – Energy and Processes
E.U. 2a – Growth, reproduction, and maintenance of the organization of living systems require free energy and matter. 2a1 – All living systems require constant input of free energy.

3
Reproduction and rearing of offspring require free energy beyond that used for maintenance and growth. Different organisms use various reproductive strategies in response to energy availability L.O. 2.2

4
The traits that affect an organism’s schedule of reproduction and survival make up its life history.
1) Age of sexual maturation and first reproduction 2) How often the organism reproduces 3) Number of offspring from each reproductive event Copyright © 2002 Pearson Education, Inc., publishing as Benjamin Cummings
 Age of sexual maturation and first reproduction. 2) How often the organism reproduces. 3) Number of offspring from each reproductive event. Copyright © 2002 Pearson Education, Inc., publishing as Benjamin Cummings.")
5
Life histories are very diverse, but they exhibit patterns in their variability
Life histories are a result of natural selection, and often parallel environmental factors. Some organisms, such as the agave plant,exhibit what is known as big-bang reproduction, where large numbers of offspring are produced in each reproduction, after which the individual often dies. Fig. 52.4 Copyright © 2002 Pearson Education, Inc., publishing as Benjamin Cummings

6
This is also known as semelparity.
By contrast, some organisms produce only a few eggs during repeated reproductive episodes. This is also known as iteroparity. What factors contribute to the evolution of semelparity and iteroparity? Practice – p #1 Copyright © 2002 Pearson Education, Inc., publishing as Benjamin Cummings

7
Changes in free energy availability can result in…
Changes in population size Disruptions to an ecosystem Example: Change in producer level can affect the number and size of other trophic levels Change in energy resources levels such as sunlight can affect the number and size of the trophic levels L.O. 2.3

8
Introduction The amount of light energy converted to chemical energy by an ecosystem’s autotrophs in a given time period is called primary production. Copyright © 2002 Pearson Education, Inc., publishing as Benjamin Cummings

9
An ecosystem’s energy budget depends on primary production
Most primary producers use light energy to synthesize organic molecules, which can be broken down to produce ATP; there is an energy budget in an ecosystem. Can’t spend more energy than bring in Copyright © 2002 Pearson Education, Inc., publishing as Benjamin Cummings

10
The Global Energy Budget
Every day, Earth is bombarded by large amounts of solar radiation. Much of this radiation lands on the water and land that either reflect or absorb it. Of the visible light that reaches photosynthetic organisms, about only 1% is converted to chemical energy. Although this is a small amount, primary producers are capable of producing about 170 billion tons of organic material per year. Copyright © 2002 Pearson Education, Inc., publishing as Benjamin Cummings

11
Gross and Net Primary Production.
Total primary production is known as gross primary production (GPP). This is the amount of light energy that is converted into chemical energy. The net primary production (NPP) is equal to gross primary production minus the energy used by the primary producers for respiration (R): NPP = GPP – R Copyright © 2002 Pearson Education, Inc., publishing as Benjamin Cummings
. This is the amount of light energy that is converted into chemical energy. The net primary production (NPP) is equal to gross primary production minus the energy used by the primary producers for respiration (R): NPP = GPP – R. Copyright © 2002 Pearson Education, Inc., publishing as Benjamin Cummings.")
12
The amount of chemical energy in consumers’ food that is converted to their own new biomass during a given time period is called secondary production. Copyright © 2002 Pearson Education, Inc., publishing as Benjamin Cummings

13
Production Efficiency.
The efficiency of energy transfer between trophic levels is usually less than 20% Production Efficiency. One way to understand secondary production is to examine the process in individual organisms. Fig Copyright © 2002 Pearson Education, Inc., publishing as Benjamin Cummings

14
Energy Dynamics Lab – we didn’t do http://media. collegeboard
Basically, you grow Fast Plants, measuring their biomass change over time to estimate their NPP (Net primary productivity):
:")
15
Test Yourself

16
Sample data

17
Next step: Estimating Energy Flow Between Fast Plants Producers and Cabbage Butterfly Larvae
Then, you grow caterpillars on the Fast Plants and brussel sprouts and measure their biomass over time to calculate:

18
Sample Data

19
Inquiry Part – what would you study?
• Do all plants have the same percentage of biomass? • Is the percentage of biomass the most important characteristic of a plant in terms of its effect on the growth of an animal? • How do plants with different life strategies allocate biomass in different organs? • How much is allocated to reproduction? • How much energy is allocated to plant defense? • How much energy does it cost an animal to process different plant sources?

20
Sample questions • Do all plants have the same percentage of biomass?
• Is the percentage of biomass the most important characteristic of a plant in terms of its effect on the growth of an animal? • How do plants with different life strategies allocate biomass in different organs? • How much is allocated to reproduction? • How much energy is allocated to plant defense? • How much energy does it cost an animal to process different plant sources?

21
Food Web Practice Problem/Grid-In, L.O. 4.14

22
Fig Copyright © 2002 Pearson Education, Inc., publishing as Benjamin Cummings

23
2.A.3 – Organisms must exchange matter with the environment to grow, reproduce and maintain organization. Molecules and atoms from the environment are necessary to build new molecules. Carbon moves from the environment to organisms where it is used to build carbohydrates, proteins, lipids, or nucleic acids. Carbon is used in storage compounds and cell formation in all organisms. Nitrogen moves from the environment to organisms where it is used in building proteins and nucleic acids. Phosphorous moves from the environment to organisms where it is used in nucleic acids and certain lipids. L.O. 2.9

24
Figure 54.20 reviews chemical cycling in ecosystems.
Copyright © 2002 Pearson Education, Inc., publishing as Benjamin Cummings

25
The carbon cycle fits the generalized scheme of biogeochemical cycles better than water.
Fig Copyright © 2002 Pearson Education, Inc., publishing as Benjamin Cummings

26
Fig Copyright © 2002 Pearson Education, Inc., publishing as Benjamin Cummings

27
Fig Copyright © 2002 Pearson Education, Inc., publishing as Benjamin Cummings

28
Nutrient Cycling is strongly regulated by vegetation
Fig Copyright © 2002 Pearson Education, Inc., publishing as Benjamin Cummings

29
E.U. 2d – Growth and dynamic homeostasis of a biological system are influenced by changes in the system’s environment 2.D.1 – All biological systems from cells and organisms to populations, communities, and ecosystems are affected by complex biotic and abiotic interactions involving exchange of matter and free energy L.O. 2.22, 2.23, 2.24

30
Organism activities are affected by interactions with biotic and abiotic factors
Examples – Symbiosis, Predator-prey relationships, Water and nutrient availability, temperature, salinity, pH

31
The stability of populations, communities and ecosystems is affected by interactions with biotic and abiotic factors. Examples – Water and nutrient availability, availability of nesting materials and sites, food chains and food webs, species diversity, population density, algal blooms

32
Biogeography is the study of past and present distributions of individual species, which provides a good starting point to understanding what limits geographic distributions. Ecologists ask a series of questions to determine what limits the geographical distribution of any species. Fig. 50.5 Copyright © 2002 Pearson Education, Inc., publishing as Benjamin Cummings

33
Biotic factors affect the distribution of organisms
Predator removal experiments can show how predators limit distribution of prey species. Fig. 50.9 Copyright © 2002 Pearson Education, Inc., publishing as Benjamin Cummings

34
4.Abiotic factors affect the distribution of organisms
Temperature Water Sunlight The intensity and quality of light, and photoperiod can be important to the development and behavior of many organisms. Wind amplifies the effects of temperature by increasing heat and water loss (wind-chill factor). Rocks and soil
. Rocks and soil.")
35
Mineral nutrients in the soil (or water) can play key roles in limiting primary production
Ecologists use the term limiting nutrient to define the nutrient that must be added for production to increase. Typically nitrogen and/or phosphorous. Scientific studies relating nutrients to production have practical applications in agriculture. Fig. 54.9 Copyright © 2002 Pearson Education, Inc., publishing as Benjamin Cummings

36
L.O. 2.22

37
2.D.2- Homeostatic mechanisms reflect both common ancestry and divergence due to adaptation in different environments. Continuity of homeostatic mechanisms reflects common ancestry, while changes may occur in response to different environmental conditions. L.O. 2.25, 2.27

38
2.D.3 – Biological systems are affected by disruptions to their dynamic homeostasis
Disruptions to ecosystems impact the dynamic homeostasis or balance of the ecosystem Example – Invasive species, Human impact, Natural disasters, Water limitation, Salination L.O. 2.28

39
Most communities are in a state of nonequilibrium owing to disturbances
Disturbances are events like fire, weather, or human activities that can alter communities. Some natural disturbances are necessary. Fig Copyright © 2002 Pearson Education, Inc., publishing as Benjamin Cummings

40
E.U. 2E- Many biological processes involved in growth, reproduction, and dynamic homeostasis include temporal regulation and coordination 2.E.3 – Timing and coordination of behavior are regulated by various mechanisms and are important in natural selection I

41
Individuals can act on information and communicate it to others
Innate behaviors = inherited Fixed action pattern and sign stimuli Developmental milestones in infants (such as stranger fear) Learned behaviors = learn from interactions with the environment and with other organisms Trial and error learning, Associative learning, Imprinting (sensitive period during early development)
 Learned behaviors = learn from interactions with the environment and with other organisms. Trial and error learning, Associative learning, Imprinting (sensitive period during early development)")
42
INNATE Fixed action pattern (FAP)
A sequence of behavioral acts that is essentially unchangeable and usually carried to completion once initiated. The FAP is triggered by an external sensory stimulus known as a sign stimulus (stimuli are usually obvious). The FAP usually occurs in a series of actions the same way every time. Many animals tend to use a relatively small subset of the sensory information available to them and behave stereotypically. INNATE Copyright © 2002 Pearson Education, Inc., publishing as Benjamin Cummings
. The FAP usually occurs in a series of actions the same way every time. Many animals tend to use a relatively small subset of the sensory information available to them and behave stereotypically. INNATE. Copyright © 2002 Pearson Education, Inc., publishing as Benjamin Cummings.")
43
Fig. 51.2 Copyright © 2002 Pearson Education, Inc., publishing as Benjamin Cummings

44
LEARNED Operant conditioning.
This is called trial-and-error learning - an animal learns to associate one of its own behaviors with a reward or a punishment. LEARNED Fig Copyright © 2002 Pearson Education, Inc., publishing as Benjamin Cummings

45
The study of cognition connects nervous system function with behavior
Cognition is the ability of an animal’s nervous system to perceive, store, process, and use information gathered by sensory receptors. Fig Copyright © 2002 Pearson Education, Inc., publishing as Benjamin Cummings

46
Animals use various cognitive mechanisms during movement through space
Kinesis and taxis. These are the simplest mechanisms of movement. Kinesis is a change in activity rate in response to a stimulus. For example, sowbugs are more active in dry areas and less active in humid areas. Taxis is an automatic, oriented movement to or away from a stimulus. For example, phototaxis, chemotaxis, and geotaxis. Copyright © 2002 Pearson Education, Inc., publishing as Benjamin Cummings

47
Use of landmarks within a familiar area.
Some organisms move in response to a recognized object or environmental cue, the object is the landmark. Cognitive maps. Some animals form cognitive maps (internal codes of spatial relationships of objects in the environment). Copyright © 2002 Pearson Education, Inc., publishing as Benjamin Cummings
. Copyright © 2002 Pearson Education, Inc., publishing as Benjamin Cummings.")
48
Migration Behavior. Migration is the regular movement of animals over relatively long distances. Piloting: an animal moves from one familiar landmark to another until it reaches its destination. Fig Copyright © 2002 Pearson Education, Inc., publishing as Benjamin Cummings

49
Orientation: animals can detect directions and travel in particular paths until reaching destination. Navigation is the most complex, and involves determining one’s present location relative to other locations in addition to detecting compass directions. Cues for these behaviors include the earth’s magnetic field, the sun, and the stars. Fig Copyright © 2002 Pearson Education, Inc., publishing as Benjamin Cummings

50
Responses to information and communication of information are vital to natural selection
Animal behaviors are triggered by environmental cues and are vital to reproduction, natural selection and survival. Examples: Hibernation, Migration, Courtship L.O and 2.39 and 2.40

51
Cooperative behavior within or between populations contributes to the survival of the populations.
Examples – Niche and resource partitioning, Mutualistic relationships (lichens, bacteria in digestive tracts of animals)
")
52
Big Idea 3 – Genetics and Information
E.U. 3E – Transmission of information results in changes within and between biological systems 3E1 – Individuals can act on information and communicate it to others

53
Examples – Predator warnings, protection of young, avoidance responses
Organisms exchange information with each other in response to internal changes and external cues, which can change behavior. Examples – Predator warnings, protection of young, avoidance responses L.O and 3.41 and 3.42

54
Predator Warning The alarm calls of vervet monkeys provide an example of how animals improve their performance of behavior. Fig. 51.8 Copyright © 2002 Pearson Education, Inc., publishing as Benjamin Cummings

55
Communication occurs through various mechanisms
Living systems have a variety of signal behaviors or cues that produce changes in the behavior of other organisms and can result in differential reproductive success Example – Territorial marking

56
Communication occurs through various mechanisms
Animals use visual, audible, tactile, electrical, and chemical signals to indicate dominance, find food, establish territory and ensure reproductive success. Examples – Bee dance, Territorial marking, Pack behavior, Herd/schooling behavior, Predator warning, Coloration

57
Social interactions depend on diverse modes of communication
Defining animal signals and communication. A signal is a behavior that causes a change in the behavior of another animal. The transmission of, reception of, and response to signals make up communication. Examples include the following: Displays such as singing, and howling. Information can be transmitted in other ways, such as chemical, tactile, electrical. Copyright © 2002 Pearson Education, Inc., publishing as Benjamin Cummings

58
Pheromones are chemicals released by an individual that bring about mating and other behaviors.
Examples include bees and ants. Fig Copyright © 2002 Pearson Education, Inc., publishing as Benjamin Cummings

59
The Dance of the Honeybee.
Bees forage to maximize their food intake. If an individual finds a good food source, it will communicate the location to others in the hive through an elaborate dance. Fig Copyright © 2002 Pearson Education, Inc., publishing as Benjamin Cummings

60
Responses to information and communication of information are vital to natural selection and evolution Natural selection favors innate and learned behaviors that increase survival and reproductive fitness. Example – parent and offspring interactions, migration, courtship/mating behaviors, foraging in bees, avoidance behaviors to poisons

61
Parent/offspring interactions
Parental investment refers to the time and resources expended for raising of offspring. It is generally lower in males because they are capable of producing more gametes (which are also smaller), therefore making each one less valuable. Females usually invest more time into parenting because they make fewer, larger gametes, a process which is energetically more expensive, thus making each gamete more valuable. In terms of mate choice, females are usually more discriminating in terms of the males with whom they choose to mate. Females look for more fit males (i.e., better genes), the ultimate cause of the choice. Copyright © 2002 Pearson Education, Inc., publishing as Benjamin Cummings
, therefore making each one less valuable. Females usually invest more time into parenting because they make fewer, larger gametes, a process which is energetically more expensive, thus making each gamete more valuable. In terms of mate choice, females are usually more discriminating in terms of the males with whom they choose to mate. Females look for more fit males (i.e., better genes), the ultimate cause of the choice. Copyright © 2002 Pearson Education, Inc., publishing as Benjamin Cummings.")
62
Courtship behavior consists of patterns that lead to copulation and consists of a series of displays and movements by the male or female. Allows members of the same species to recognize each other.

63
Animal defenses against predators.
Plant defenses against herbivores include chemical compounds that are toxic. Animal defenses against predators. Behavioral defenses include fleeing, hiding, self-defense, noises, and mobbing. Camouflage includes cryptic coloration, deceptive markings. Fig. 53.5 Copyright © 2002 Pearson Education, Inc., publishing as Benjamin Cummings

64
Mechanical defenses include spines.
Chemical defenses include odors and toxins Aposematic coloration is indicated by warning colors, and is sometimes associated with other defenses (toxins). Fig. 53.6 Copyright © 2002 Pearson Education, Inc., publishing as Benjamin Cummings
. Fig Copyright © 2002 Pearson Education, Inc., publishing as Benjamin Cummings.")
65
Mimicry is when organisms resemble other species.
Batesian mimicry is where a harmless species mimics a harmful one. Fig. 53.7 Copyright © 2002 Pearson Education, Inc., publishing as Benjamin Cummings

66
Müllerian mimicry is where two or more unpalatable species resemble each other.
Fig. 53.8 Copyright © 2002 Pearson Education, Inc., publishing as Benjamin Cummings

67
Responses to information and communication of information are vital to natural selection and evolution Cooperative behavior tends to increase the fitness of the individual and the survival of the population Examples – pack behavior, herd/schooling behavior, predator warning Excludes details of various communications and community behavioral systems

68
Big Idea 4 – Complex Interactions of Biological Systems
E.U.4A – Interactions within biological systems lead to complex properties “the whole is greater than the sum of its parts”

69
4.A.5 – Communities are composed of populations of organisms that interact in complex ways.
The structure of a community is measured and described in terms of species composition and species diversity

70
Community biodiversity measures the number of species and their relative abundance
The variety of different kinds of organisms that make up a community has two components. Species richness, the total number of species in the community. Relative abundance of the different species. Imagine two small forest communities with 100 individuals distributed among four different tree species. Copyright © 2002 Pearson Education, Inc., publishing as Benjamin Cummings

71
Species richness may be equal, but relative abundance may be different.
Fig Copyright © 2002 Pearson Education, Inc., publishing as Benjamin Cummings

72
4.A.5 – Communities are composed of populations of organisms that interact in complex ways.
Mathematical or computer models are used to illustrate and investigate population interactions within and environmental impacts on a community. Examples – predator/prey relationships spreadsheet model, symbiotic relationship, graphical representation of data, introduction of species, global climate change models L.O.4.11, 4.12, 4.13 Show drawing of predator/prey population curves and how to find lag time

73
4.A.5 – Communities are composed of populations of organisms that interact in complex ways.
Mathematical models and graphical representations are used to illustrate population growth patterns and interactions Reproduction without constraints results in the exponential growth of a population. A population can produce a density of individuals that exceeds the system’s resource availability. As limits to growth due to density-dependent and density-independent factors are imposed, a logistic growth model generally ensues. Demographics data with respect to age distributions and fecundity can be used to study human populations.

74
The exponential model of population describes an idealized population in an unlimited environment
Using mathematical notation we can express this relationship as follows: If N represents population size, and t represents time, then N is the change in population size and t represents the change in time, then: N/t = B-D Where B is the number of births and D is the number of deaths Copyright © 2002 Pearson Education, Inc., publishing as Benjamin Cummings

75
If B = D then there is zero population growth (ZPG).
We can simplify the equation and use r to represent the difference in per capita birth and death rates. N/t = rN OR dN/dt = rN If B = D then there is zero population growth (ZPG). Under ideal conditions, a population grows rapidly. Exponential population growth is said to be happening Under these conditions, we may assume the maximum growth rate for the population (rmax) to give us the following exponential growth dN/dt = rmaxN Copyright © 2002 Pearson Education, Inc., publishing as Benjamin Cummings
. Under ideal conditions, a population grows rapidly. Exponential population growth is said to be happening. Under these conditions, we may assume the maximum growth rate for the population (rmax) to give us the following exponential growth. dN/dt = rmaxN. Copyright © 2002 Pearson Education, Inc., publishing as Benjamin Cummings.")
76
Fig. 52.9 Copyright © 2002 Pearson Education, Inc., publishing as Benjamin Cummings

77
The logistic model of population growth incorporates the concept of carrying capacity
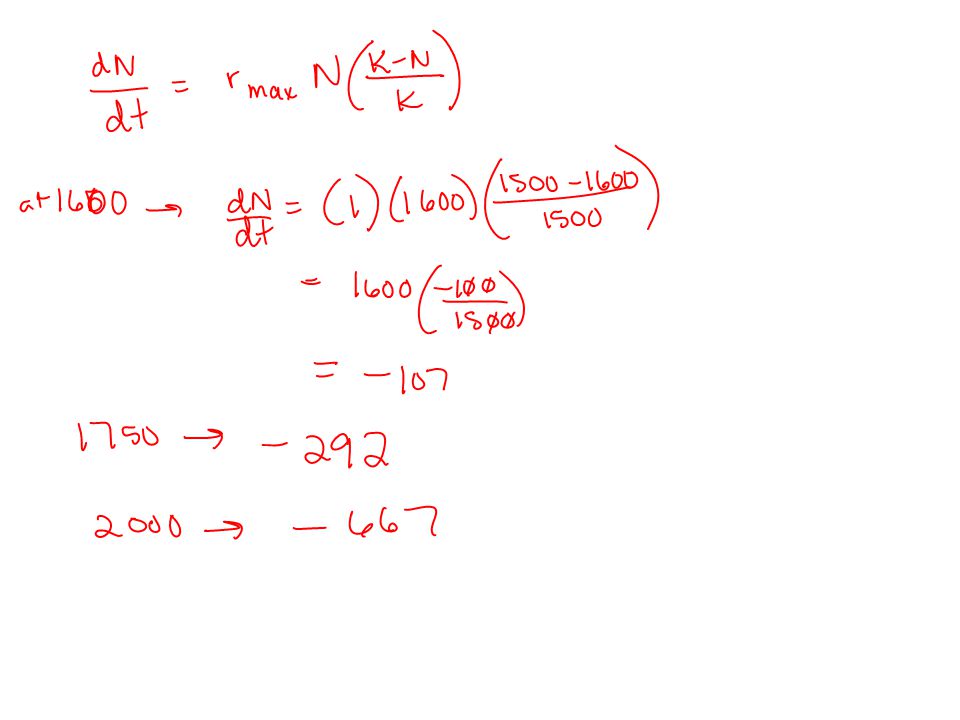
Typically, unlimited resources are rare. Population growth is therefore regulated by carrying capacity (K), which is the maximum stable population size a particular environment can support. Copyright © 2002 Pearson Education, Inc., publishing as Benjamin Cummings
, which is the maximum stable population size a particular environment can support. Copyright © 2002 Pearson Education, Inc., publishing as Benjamin Cummings.")
78
The logistic growth equation
We can modify our model of population growth to incorporate changes in growth rate as population size reaches a carrying capacity. The logistic population growth model incorporates the effect of population density on the rate of increase. Copyright © 2002 Pearson Education, Inc., publishing as Benjamin Cummings

79
dN/dt = rmaxN((K-N)/K)
The graph of this equation shows an S-shaped curve. Fig Copyright © 2002 Pearson Education, Inc., publishing as Benjamin Cummings

80
The logistic population growth model and life histories.
This model predicts different growth rates for different populations, relative to carrying capacity. Resource availability depends on the situation. The life history traits that natural selection favors may vary with population density and environmental conditions. In K-selection, organisms live and reproduce around K, and are sensitive to population density. In r-selection, organisms exhibit high rates of reproduction and occur in variable environments in which population densities fluctuate well below K. Copyright © 2002 Pearson Education, Inc., publishing as Benjamin Cummings

81
Practice problems P #3, p #2 p.1179 # 3

84
Fig Copyright © 2002 Pearson Education, Inc., publishing as Benjamin Cummings

85
The Demographic Transition.
A regional human population can exist in one of 2 configurations. Zero population growth = high birth rates – high death rates. Zero population growth = low birth rates – low death rates. Copyright © 2002 Pearson Education, Inc., publishing as Benjamin Cummings

86
The movement from the first toward the second state is called the demographic transition.
Fig Copyright © 2002 Pearson Education, Inc., publishing as Benjamin Cummings

87
Age structure is the relative number of individuals of each age.
Age structure diagrams can reveal a population’s growth trends, and can point to future social conditions. Copyright © 2002 Pearson Education, Inc., publishing as Benjamin Cummings

88
X Fig Copyright © 2002 Pearson Education, Inc., publishing as Benjamin Cummings

89
4.A.6 – Interactions among living systems and with their environment result in the movement of matter and energy. Energy flows, but matter is recycled. Changes in regional and global climates and in atmospheric composition influence patterns of primary productivity. Organisms within food webs and food chains interact. Food webs and food chains are dependent on primary productivity.

90
X Food Web Practice MC, L.O.4.15

91
4.A.6 – Interactions among living systems and with their environment result in the movement of matter and energy. Models allow the prediction of the impact of change in biotic and abiotic factors Competition for resources and other factors limits growth and can be described by the logistic model. Competition for resources, territoriality, health, predation, accumulation of wastes and other factors contribute to density-dependent population regulation.

92
Why do all populations eventually stop growing?
What environmental factors stop a population from growing? The first step to answering these questions is to examine the effects of increased population density. Copyright © 2002 Pearson Education, Inc., publishing as Benjamin Cummings

93
Density-dependent factors increase their affect on a population as population density increases.
This is a type of negative feedback. Density-independent factors are unrelated to population density, and there is no feedback to slow population growth. Fig Copyright © 2002 Pearson Education, Inc., publishing as Benjamin Cummings

94
Types of Density-Dependent Factors
A variety of factors can cause negative feedback. 1) Resource limitation in crowded populations can stop population growth by reducing reproduction. Fig.52.14 Copyright © 2002 Pearson Education, Inc., publishing as Benjamin Cummings
 Resource limitation in crowded populations can stop population growth by reducing reproduction. Fig Copyright © 2002 Pearson Education, Inc., publishing as Benjamin Cummings.")
95
3) Territoriality, defense of a space, may set a limit on density.
2) Intraspecific competition for food can also cause density-dependent behavior of populations. 3) Territoriality, defense of a space, may set a limit on density. 4) Predation may also be a factor because it can cause mortality of prey species. Fig Copyright © 2002 Pearson Education, Inc., publishing as Benjamin Cummings
 Intraspecific competition for food can also cause density-dependent behavior of populations. 3) Territoriality, defense of a space, may set a limit on density. 4) Predation may also be a factor because it can cause mortality of prey species. Fig Copyright © 2002 Pearson Education, Inc., publishing as Benjamin Cummings.")
96
5) Waste accumulation is another component that can regulate population size.
In wine, as yeast populations increase, they make more alcohol during fermentation. However, yeast can only withstand an alcohol percentage of approximately 13% before they begin to die. 6) Disease can also regulate population growth, because it spreads more rapidly in dense populations. Practice – p.1193 #13 Copyright © 2002 Pearson Education, Inc., publishing as Benjamin Cummings
 Disease can also regulate population growth, because it spreads more rapidly in dense populations. Practice – p.1193 #13. Copyright © 2002 Pearson Education, Inc., publishing as Benjamin Cummings.")
97
4.A.6 – Interactions among living systems and with their environment result in the movement of matter and energy. Human activities impact ecosystems on local, regional, and global scales. As human populations have increased in numbers, their impact on habitats for other species have been magnified. In turn, this has often reduced the population size of the affected species and resulted in habitat destruction and, in some cases, the extinction of species.

98
The loss of species also means the loss of genes.
Biodiversity is a crucial natural resource, and species that are threatened could provide crops, fibers, and medicines for human use. The loss of species also means the loss of genes. Biodiversity represents the sum of all the genomes on Earth. Fig. 55.3

99
Restoring degraded areas is an increasingly important conservation effort
Restoration ecology applies ecological principles in developing ways to return degraded areas to natural conditions. Biological communities can recover from many types of disturbances, through a series of restoration mechanisms that occur during ecological succession. Copyright © 2002 Pearson Education, Inc., publishing as Benjamin Cummings

100
Fig Copyright © 2002 Pearson Education, Inc., publishing as Benjamin Cummings

101
Bioremediation is the use of living organisms to detoxify polluted ecosystems.
Restoration ecologists use various types of organisms to remove many different types of toxins from ecosystems. Fig Copyright © 2002 Pearson Education, Inc., publishing as Benjamin Cummings

102
4.A.6 – Interactions among living systems and with their environment result in the movement of matter and energy. Many adaptations of organisms are related to obtaining and using energy and matter in a particular environment. L.O. 4.14, 4.15, 4.16

103
Competition. Interspecific competition for resources can occur when resources are in short supply. There is potential for competition between any two species that need the same limited resource. The competitive exclusion principle: two species with similar needs for same limiting resources cannot coexist in the same place. Copyright © 2002 Pearson Education, Inc., publishing as Benjamin Cummings

104
The ecological niche is the sum total of an organism’s use of abiotic/biotic resources in the environment. An organism’s niche is its role in the environment. The competitive exclusion principle can be restated to say that two species cannot coexist in a community if their niches are identical. X Copyright © 2002 Pearson Education, Inc., publishing as Benjamin Cummings

105
Classic experiments confirm this.
Fig. 53.2 Copyright © 2002 Pearson Education, Inc., publishing as Benjamin Cummings

106
X Resource partitioning is the differentiation of niches that enables two similar species to coexist in a community. Fig. 53.2 Fig. 53.3 Copyright © 2002 Pearson Education, Inc., publishing as Benjamin Cummings

107
E.U.4B- Competition and cooperation are important aspects of biological systems.
4.B.3 – Interactions between and within populations influence patterns of species distribution and abundance. L.O. 4.19

108
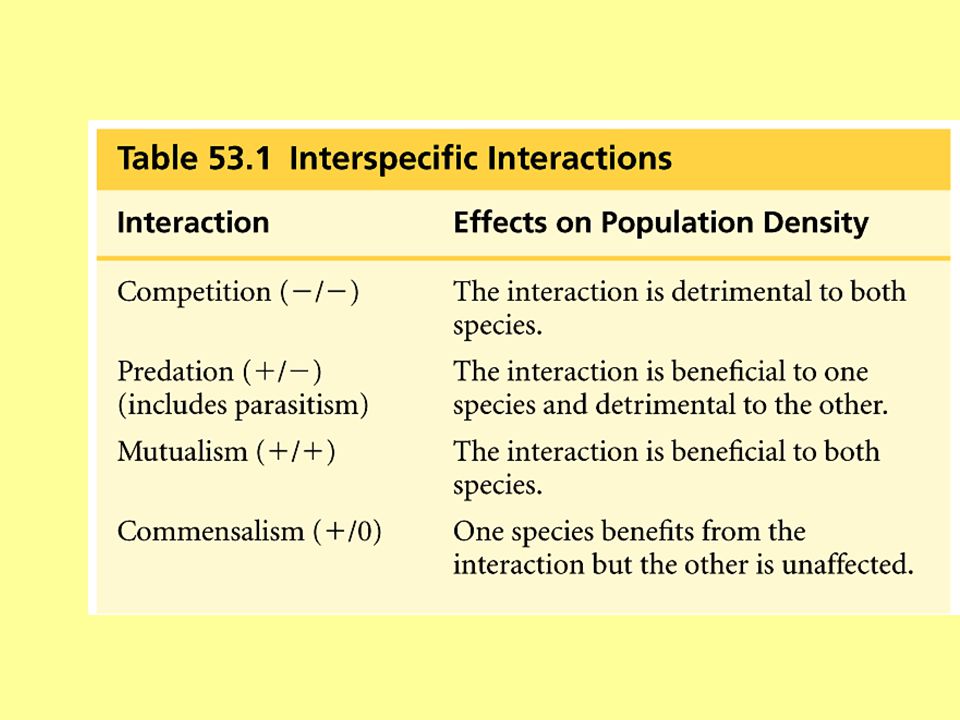
4.B.3 – Interactions between and within populations influence patterns of species distribution and abundance. Interactions between populations affect the distributions and abundance of populations. Competition, parasitism, predation, mutualism, and commensalism can affect population dynamics. Relationships among interacting populations can be characterized by positive and negative effects, and can be modeled mathematically (predator/prey, epidemiological models, invasive species.) Many complex symbiotic relationships exist in an ecosystem, and feedback control systems play a role in the functioning of these ecosystems. Specific symbiotic interactions beyond the scope.
 Many complex symbiotic relationships exist in an ecosystem, and feedback control systems play a role in the functioning of these ecosystems. Specific symbiotic interactions beyond the scope.")
110
4.B.3 – Interactions between and within populations influence patterns of species distribution and abundance. X A population of organisms has properties that are different from those of the individuals that make up the population. The cooperation and competition between individuals contributes to these different properties. Species-specific and environmental catastrophes, geological events, the sudden influx/depletion of abiotic resources or increased human activities affect species distribution and abundance. Example – loss of keystone species

111
4.B.4 – Distribution of local and global ecosystems changes over time
X 4.B.4 – Distribution of local and global ecosystems changes over time Human impact accelerates change at local and global levels Examples – Logging, slash and burn, urbanization, monocropping, infrastructure development (dams, roads), and global climate change threaten ecosystems and life on Earth Introduced species can exploit a new niche free of predators or competitors, thus exploiting new resources Introduction of new diseases can devastate native species such as Dutch Elm disease, Potato blight, smallpox and Native Americans
, and global climate change threaten ecosystems and life on Earth. Introduced species can exploit a new niche free of predators or competitors, thus exploiting new resources. Introduction of new diseases can devastate native species such as Dutch Elm disease, Potato blight, smallpox and Native Americans.")
112
X During the 1970s, sewage and fertilizer pollution added nutrients to lakes, which shifted many lakes from having phytoplankton communities to those dominated by diatoms and green algae. This process is called eutrophication, and has undesirable impacts from a human perspective. Copyright © 2002 Pearson Education, Inc., publishing as Benjamin Cummings

113
Combustion of fossil fuels is the main cause of acid precipitation
The burning of fossil fuels releases sulfur oxides and nitrogen that react with water in the atmosphere to produce sulfuric and nitric acids. Fig a Copyright © 2002 Pearson Education, Inc., publishing as Benjamin Cummings

114
These acids fall back to earth as acid precipitation, and can damage ecosystems greatly.
The acids can kill plants, and can kill aquatic organisms by changing the pH of the soil and water. Fig b Copyright © 2002 Pearson Education, Inc., publishing as Benjamin Cummings

115
Toxins can become concentrated in successive trophic levels of food webs
Humans produce many toxic chemicals that are dumped into ecosystems. These substances are ingested and metabolized by the organisms in the ecosystems and can accumulate in the fatty tissues of animals. These toxins become more concentrated in successive trophic levels of a food web, a process called biological magnification. Copyright © 2002 Pearson Education, Inc., publishing as Benjamin Cummings

116
The pesticide DDT, before it was banned, showed this effect.
Fig The pesticide DDT, before it was banned, showed this effect. Copyright © 2002 Pearson Education, Inc., publishing as Benjamin Cummings

117
X Fig Copyright © 2002 Pearson Education, Inc., publishing as Benjamin Cummings

118
Human activities may be causing climate change by increasing carbon dioxide concentration in the atmosphere Rising atmospheric CO2. Since the Industrial Revolution, the concentration of CO2 in the atmosphere has increased greatly as a result of burning fossil fuels. Copyright © 2002 Pearson Education, Inc., publishing as Benjamin Cummings

119
The greenhouse effect. Rising levels of atmospheric CO2 may have an impact on Earth’s heat budget. When light energy hits the Earth, much of it is reflected off the surface. CO2 causes the Earth to retain some of the energy that would ordinarily escape the atmosphere. This phenomenon is called the greenhouse effect. The Earth needs this heat, but too much could be disastrous. Copyright © 2002 Pearson Education, Inc., publishing as Benjamin Cummings

120
Global warming. Scientists continue to construct models to predict how increasing levels of CO2 in the atmosphere will affect Earth. Several studies predict a doubling of CO2 in the atmosphere will cause a 2º C increase in the average temperature of Earth. Rising temperatures could cause polar ice cap melting, which could flood coastal areas. It is important that humans attempt to stabilize their use of fossil fuels. Copyright © 2002 Pearson Education, Inc., publishing as Benjamin Cummings

121
Human activities are depleting the atmospheric ozone
Life on earth is protected from the damaging affects of ultraviolet radiation (UV) by a layer of O3, or ozone. Studies suggest that the ozone layer has been gradually “thinning” since 1975. Fig a Copyright © 2002 Pearson Education, Inc., publishing as Benjamin Cummings
 by a layer of O3, or ozone. Studies suggest that the ozone layer has been gradually thinning since Fig a. Copyright © 2002 Pearson Education, Inc., publishing as Benjamin Cummings.")
122
Fig b Copyright © 2002 Pearson Education, Inc., publishing as Benjamin Cummings

123
The destruction of ozone probably results from the accumulation of chlorofluorocarbons, chemicals used in refrigeration and aerosol cans, and in certain manufacturing processes. The result of a reduction in the ozone layer may be increased levels of UV radiation that reach the surface of the Earth. This radiation has been linked to skin cancer and cataracts. The impact of human activity on the ozone layer is one more example of how much we are able to disrupt ecosystems and the entire biosphere. Copyright © 2002 Pearson Education, Inc., publishing as Benjamin Cummings

124
4.B.4 – Distribution of local and global ecosystems changes over time
Geological and meteorological events impact ecosystem distribution. Biogeographical studies illustrate these changes Examples – El Nino, continental drift, meteor impact on dinosaurs L.O. 4.20, 4.21

125
E.U. 4C – Naturally occurring diversity among and between components within biological systems affects interactions with the environment

126
4.C.4 – The diversity of species within an ecosystem may influence the stability of the ecosystem
X Natural and artificial ecosystems with fewer component parts and with little diversity among the parts are often less resilient to changes in the environment. Keystone species, producers, and essential abiotic and biotic factors contribute to maintaining the diversity of an ecosystem. The effects of keystone species on the ecosystem are disproportionate relative to their abundance in the ecosystem, and when they are removed from the ecosystem, the ecosystem often collapses. L.O. 4.27

127
X L.O. 4.27

128
Dominant species and keystone species exert strong controls on community structure
Dominant species are those in a community that have the highest abundance or highest biomass (the sum weight of all individuals in a population). If we remove a dominant species from a community, it can change the entire community structure. Copyright © 2002 Pearson Education, Inc., publishing as Benjamin Cummings
. If we remove a dominant species from a community, it can change the entire community structure. Copyright © 2002 Pearson Education, Inc., publishing as Benjamin Cummings.")
129
X Keystone species exert an important regulating effect on other species in a community. These sea stars control a mussel species that takes over if not held in check. Fig Copyright © 2002 Pearson Education, Inc., publishing as Benjamin Cummings

130
If they are removed, community structure is greatly affected.
X If they are removed, community structure is greatly affected. Otters control sea urchins Fig Copyright © 2002 Pearson Education, Inc., publishing as Benjamin Cummings

Similar presentations


 – PREVALENT.>")

:>")


