Download presentation
Presentation is loading. Please wait.

1
Robert C. Joiner L.A. Conference 2012

40
… using Heiken-Ashi Candles.

41
… using Fibonacci Retracements and Pivot lines.

43
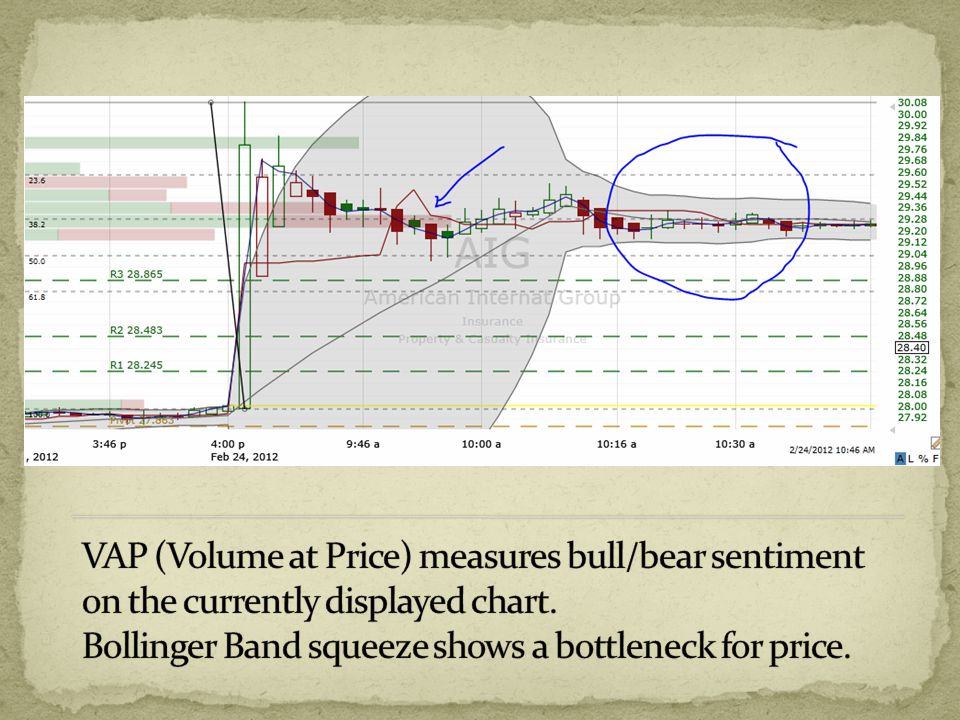
…using HA candles, BB, Fibonacci, Pivot lines, and VAP.

44
HA Candles use more of an internal moving average of sorts to show price trend. I use HAF (a Heiken-Ashi Fractal) to determine the continuity of that trend.
 to determine the continuity of that trend..")
46
Price is breaking through successive lines of support. I find reasons for staying in the short trade based on this fact, plus HAF, VAP gaps, and weakness below the BB midline.

49
…a 10-minute view.

50
Price crosses Tenkan-Sen and finds resistance to that line until it breaks through the thin Kumo. PVT stays below 18 moving average for 3 hours.

Similar presentations


![Pocketman Futures Live LBR [16:17:50]> Good Afternoon [16:18:15]> getting sneak preview [16:18:23]>](/15/4589362/big_thumb.jpg "Pocketman Futures Live LBR [16:17:50]> Good Afternoon [16:18:15]> getting sneak preview [16:18:23]>>")


 SYSTEM 1FINAFREE INVESTMENTS.>")

