Download presentation
Presentation is loading. Please wait.

1
Financial Management Discussion 9,10 & 11

2
Liquidity: Assets Management Ratios: The Total Assets Turnover Ratio:

3
total debt ratio : Times Interest Earned (TIE) : EBITDA Coverage Ratio : Profit Margin on Sales:
 : EBITDA Coverage Ratio : Profit Margin on Sales:")
4
Basic Earning Power (BEP) : Return on Assets (ROA): Return on Equity (ROE):
 : Return on Assets (ROA): Return on Equity (ROE):")
5
Market Value Ratios :

9
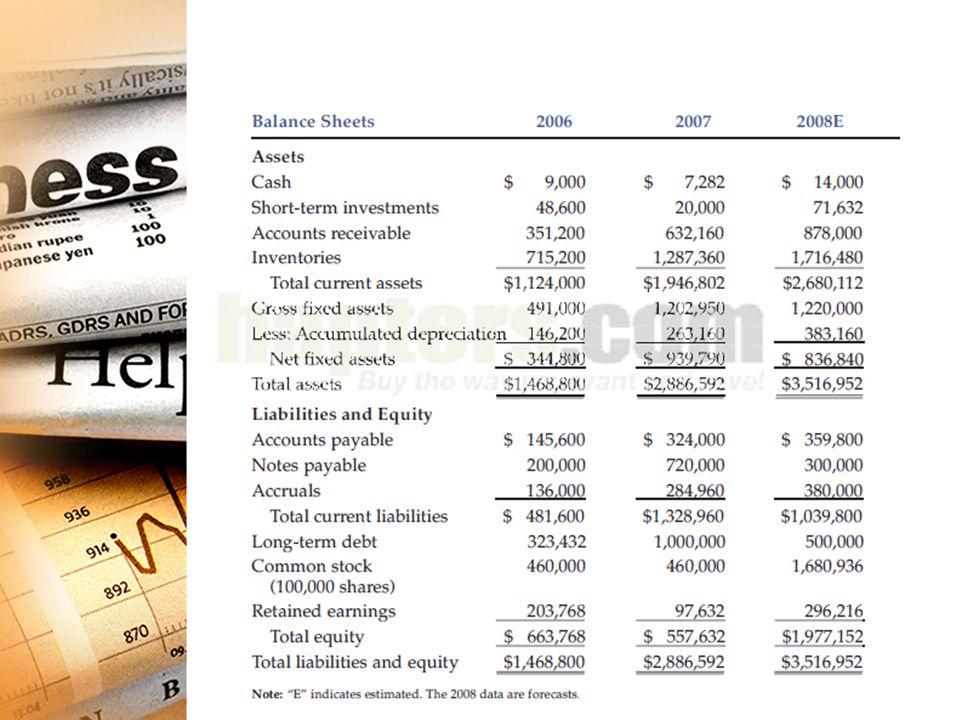
Current Ratio 08 = Current Assets/Current Liabilities = $2,680,112/$1,039,800 = 2.58 . Quick Ratio 08 = (Current Assets – Inventory)/Current Liabilities = ($2,680,112 - $1,716,480)/$1,039,800 = 0.93 . The company’s current and quick ratios are higher relative to its 2006 current and quick ratios; they have improved from their 2007 levels. Both ratios are below the industry average, however.
/Current Liabilities = ($2,680,112 - $1,716,480)/$1,039,800 = 0.93 . The company’s current and quick ratios are higher relative to its 2006 current and quick ratios; they have improved from their 2007 levels. Both ratios are below the industry average, however..")
11
Inventory Turnover 08 =Sales/Inventory =$7,035,600/$1,716,480 = 4.10 . DSO 08 = Receivables/(Sales/365) = $878,000/($7,035,600/365) = 45.5 Days. Fixed Assets Turnover 08 = Sales/Net Fixed Assets = $7,035,600/$836,840 = 8.41 . Total Assets Turnover 08 = Sales/Total Assets = $7,035,600/$3,516,952 = 2.0 .
 = $878,000/($7,035,600/365) = 45.5 Days. Fixed Assets Turnover 08 = Sales/Net Fixed Assets = $7,035,600/$836,840 = 8.41 . Total Assets Turnover 08 = Sales/Total Assets = $7,035,600/$3,516,952 = 2.0 ..")
12
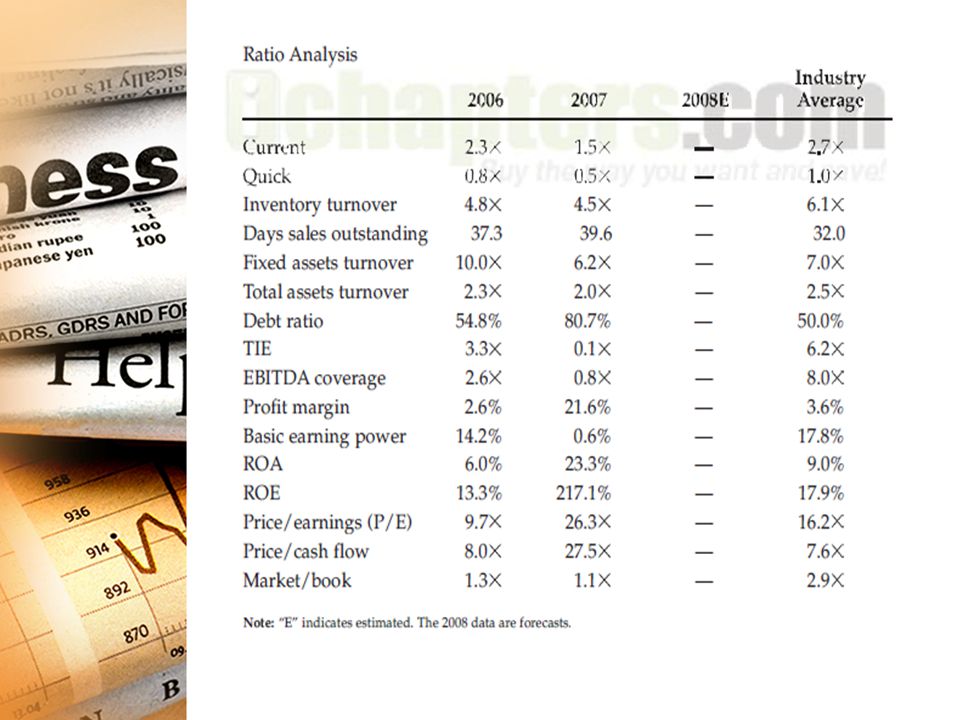
The firm’s inventory turnover ratio has been steadily declining, while its days sales outstanding has been steadily increasing. While the firm’s fixed assets turnover ratio is below its 2003 level, it is above the 2004 level. The firm’s total assets turnover ratio is below its 2003 level and equal to its 2004 level. The firm’s inventory turnover and total assets turnover are below the industry average. The firm’s days sales outstanding is above the industry average (which is bad); however, the firm’s fixed assets turnover is above the industry average. (This might be due to the fact that Computron is an older firm than most other firms in the industry, in which case, its fixed assets are older and thus have been depreciated more, or that Computron’s cost of fixed assets were lower than most firms in the industry.)
; however, the firm’s fixed assets turnover is above the industry average. (This might be due to the fact that Computron is an older firm than most other firms in the industry, in which case, its fixed assets are older and thus have been depreciated more, or that Computron’s cost of fixed assets were lower than most firms in the industry.).")
14
Debt Ratio 08 = Total Liabilities/Total Assets = ($1,039,800 + $500,000)/$3,516,952 = 43.8%. Tie 08 = EBIT/Interest = $502,640/$80,000 = 6.3 . EBITDA Coverage 08 = = ($502,640 + $120,000 + $40,000)/($80,000 + $40,000) = 5.5 .
/($80,000 + $40,000) = 5.5 ..")
15
The firm’s debt ratio is much improved from 2007, and is still lower than its 2005 level and the industry average. The firm’s TIE and EBITDA coverage ratios are much improved from their 2006 and 2007 levels. The firm’s TIE is better than the industry average, but the EBITDA coverage is lower, reflecting the firm’s higher lease obligations.

17
Profit Margin 08 = Net Income/Sales = $253,584/$7,035,600 = 3.6%. Basic Earning Power 08 = EBIT/Total Assets = $502,640/$3,516,952 = 14.3%. ROA 08 = Net Income/Total Assets = $253,584/$3,516,952 = 7.2%. ROE 08 = Net Income/Common Equity = $253,584/$1,977,152 = 12.8%.

18
The firm’s profit margin is above 2003 and 2004 levels and is at the industry average. The basic earning power, ROA, and ROE ratios are above both 2003 and 2004 levels, but below the industry average due to poor asset utilization.

20
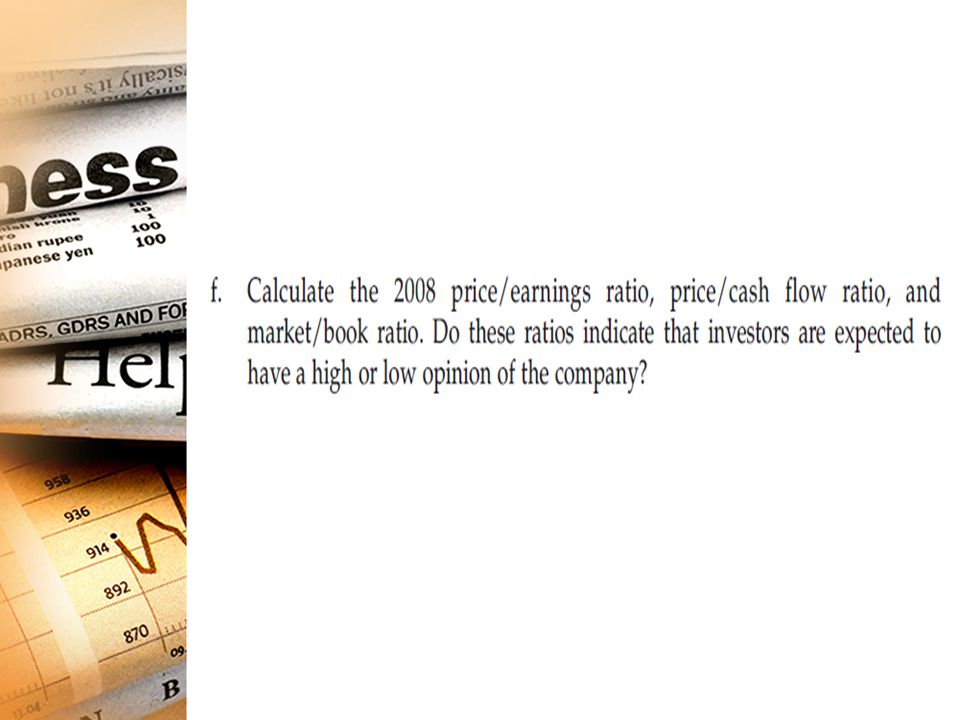
EPS = Net Income/Shares Outstanding = $253,584/250,000 = $1.0143. Price/Earnings 08 = Price Per Share/Earnings Per Share = $12.17/$1.014 = 12.0 . Cash Flow/Share 08 = (N.I. + DEP.)/Shares = ($253,584 + $120,000)/250,000 = $1.49. Price/Cash Flow = $12.17/$1.49 = 8.2 .
/Shares = ($253,584 + $120,000)/250,000 = $1.49. Price/Cash Flow = $12.17/$1.49 = 8.2 ..")
21
BVPS = Common Equity/Shares Outstanding = $1,977,152/250,000 = $7.91. Market/Book = Market Price Per Share/Book Value Per Share = $12.17/$7.909 = 1.54x. Both the P/E ratio and BVPS are above the 2006 and 2007 levels but below the industry average.

Similar presentations


>")
 2000 by Harcourt, Inc. All rights reserved. Chapter 3 Analysis of Financial Statements: Financial Statements and Reports Ratio Analysis.>")

 Analysis Of Financial Statements>")

