Download presentation
Presentation is loading. Please wait.

1
Noadswood Science, 2012

2
To understand acceleration and velocity-time graphs Wednesday, April 29, 2015

3
Speed and velocity represent how fast you are going (measured in m/s or mph or km/h etc…) However, there is a subtle difference between the two: - Speed = how fast you are going (e.g. 100mph) Velocity = how fast you are going (e.g. 100mph) with a direction (e.g. North) Two moving objects can have the same speed, but completely different velocities – e.g. a car travelling North at 50mph and a car travelling South at 50mph have the same speed, but their velocities are not the same as they are moving in opposite directions
 Velocity = how fast you are going (e.g. 100mph) with a direction (e.g. North) Two moving objects can have the same speed, but completely different velocities – e.g. a car travelling North at 50mph and a car travelling South at 50mph have the same speed, but their velocities are not the same as they are moving in opposite directions.")
4
What is acceleration? Acceleration is a measurement of how quickly the velocity is changing (i.e. how quickly you’re speeding up or slowing down (when decelerating))
).")
5
Acceleration is the change in velocity (ΔV) ÷ time (t) Acceleration (a) Change In Velocity (ΔV) Time (t) Acceleration = Change In Velocity Time Time = Change In Velocity Acceleration Change In Velocity = Acceleration x Time
 ÷ time (t) Acceleration (a) Change In Velocity (ΔV) Time (t) Acceleration = Change In Velocity Time Time = Change In Velocity Acceleration Change In Velocity = Acceleration x Time")
6
To work out acceleration you must first find the change in velocity (v-u (where v is the final velocity and u the initial velocity)) Then ÷ by the time Finally acceleration has a unit of m/s 2 (unlike velocity = m/s) a ΔV t E.g. a cat accelerates from a walking pace of 2m/s to 6m/s in 5.6 seconds – what is acceleration? Change of velocity = 6 – 2 = 4 4 ÷ 5.6 = 0.71m/s 2

7
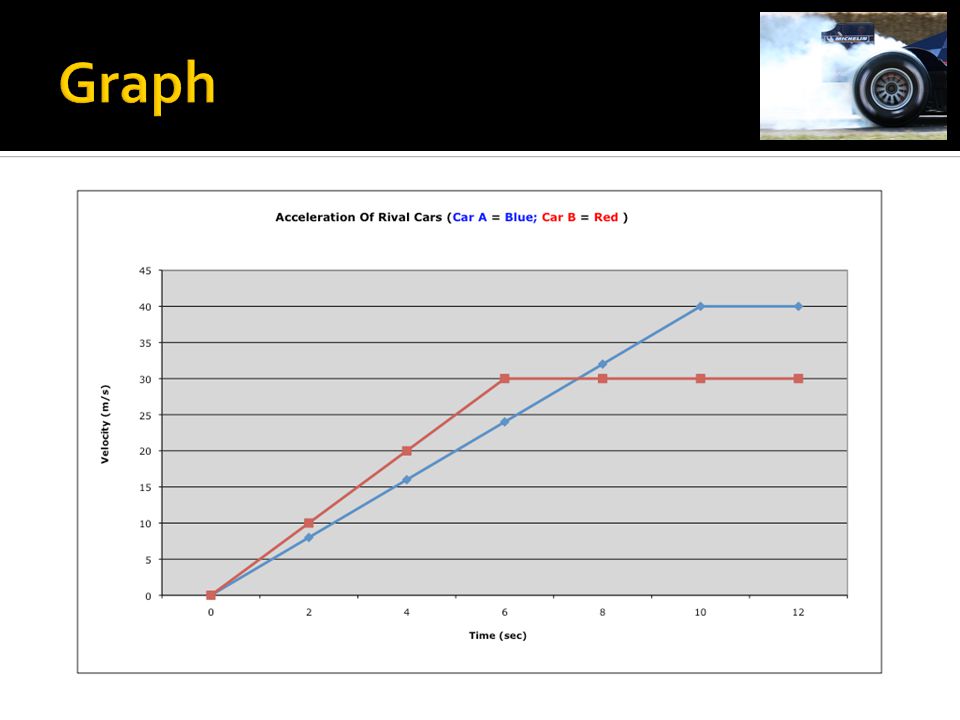
Two car rivals claim their cars are the fastest accelerating – these are tested on a straight track with velocity recorders fitted The results are shown below – graph the acceleration of the two cars from standstill to their top speed, and identify which accelerated fastest Time from standing start (seconds) 024681012 Velocity of car A (m/s) 0816243240 Velocity of car B (m/s) 0102030
 Velocity of car A (m/s) Velocity of car B (m/s)")
9
Car A top speed = 40m/s reached in 10 seconds Car B top speed = 30m/s reached in 6 seconds Acceleration = change in velocity (m/s) ÷ time (s) Car A acceleration: - Change in velocity = 40m/s – 0m/s = 40m/s Time taken = 10s Acceleration = 40m/s ÷ 10s = 4m/s 2
 ÷ time (s) Car A acceleration: - Change in velocity = 40m/s – 0m/s = 40m/s Time taken = 10s Acceleration = 40m/s ÷ 10s = 4m/s 2")
10
Car A top speed = 40m/s reached in 10 seconds Car B top speed = 30m/s reached in 6 seconds Acceleration = change in velocity (m/s) ÷ time (s) Car B acceleration: - Change in velocity = 30m/s – 0m/s = 30m/s Time taken = 6s Acceleration = 30m/s ÷ 6s = 5m/s 2
 ÷ time (s) Car B acceleration: - Change in velocity = 30m/s – 0m/s = 30m/s Time taken = 6s Acceleration = 30m/s ÷ 6s = 5m/s 2")
11
In terms of performance 60mph is ~27m/s Car B reaches 60 in just over 5 seconds, whilst it takes car A almost 7 seconds However, car A’s lesser acceleration is weighed against its higher top speed of 89mph (40m/s) against the 67mph (30m/s) of car B
 against the 67mph (30m/s) of car B")
12
What is deceleration? Deceleration (negative acceleration) is where an object slows down (such as when a driver applies the breaks)
 is where an object slows down (such as when a driver applies the breaks).")
13
1. Complete a) to c) using the key words: acceleration; speed; and velocity a) An object moving steadily round in a circle has a constant… b) If the velocity of an object increases by the same amount every second, its … is constant c) Deceleration is when the … of an object decreases 2. The velocity of a car increased from 8m/s to 28m/s in 8s without changing its direction. Calculate its change in velocity and its acceleration 3. A man moving at 2m/s accelerates by 3m/s 2 for 2.5s. Calculate his new velocity
 to c) using the key words: acceleration; speed; and velocity a) An object moving steadily round in a circle has a constant… b) If the velocity of an object increases by the same amount every second, its … is constant c) Deceleration is when the … of an object decreases 2. The velocity of a car increased from 8m/s to 28m/s in 8s without changing its direction. Calculate its change in velocity and its acceleration 3. A man moving at 2m/s accelerates by 3m/s 2 for 2.5s. Calculate his new velocity.")
14
1. a) An object moving steadily round in a circle has a constant speed b) If the velocity of an object increases by the same amount every second, its acceleration is constant c) Deceleration is when the velocity of an object decreases 2. Change in velocity = 28m/s – 8m/s = 20m/s Acceleration 20m/s ÷ 8s = 2.5m/s 2 3. Acceleration = 3m/s 2 Time = 2.5s Velocity = 7.5m/s 7.5m/s + 2m/s (original velocity) = 9.5m/s 2
 An object moving steadily round in a circle has a constant speed b) If the velocity of an object increases by the same amount every second, its acceleration is constant c) Deceleration is when the velocity of an object decreases 2. Change in velocity = 28m/s – 8m/s = 20m/s Acceleration 20m/s ÷ 8s = 2.5m/s 2 3. Acceleration = 3m/s 2 Time = 2.5s Velocity = 7.5m/s 7.5m/s + 2m/s (original velocity) = 9.5m/s 2.")
15
Velocity-Time Graphs Remember, the velocity of an object is its speed in a particular direction (this means that two cars travelling at the same speed, but in opposite directions, have different velocities) When an object is moving with a constant velocity, the line on the graph is horizontal When an object is moving with a constant acceleration, the line on the graph is straight, but sloped The steeper the line, the greater the acceleration of the object
 When an object is moving with a constant velocity, the line on the graph is horizontal When an object is moving with a constant acceleration, the line on the graph is straight, but sloped The steeper the line, the greater the acceleration of the object")
16
Acceleration Acceleration is represented on a velocity-time graph by the gradient of the line (change in velocity ÷ time) What is the acceleration - represented by the sloping line? To find the distance we need to calculate the area of the light blue and dark blue regions For rectangular areas use the formula base x height = 6s x 8m/s = 48m For triangular areas use the formula ½ x base x height = ½ x 4s x 8m/s = 16m Distance = 48 + 16 = 64m

17
Distance The area under the line on a velocity-time graph represents the distance travelled What distance was covered on the above graph? Change in velocity from 0m/s to 8m/s = 8m/s Time of 4 seconds for change in velocity 8 ÷ 4 = 2m/s 2

18
Practice Question 1 Match A, B, C and D to the following descriptions: - 1. Accelerated motion throughout 2. Zero acceleration 3. Accelerated motion, then decelerated motion 4. Deceleration Which line represents the furthest distance? Which line represents the least distance?

19
Practice Question 1 – Answer Match A, B, C and D to the following descriptions: - 1. Accelerated motion throughout – A ( 1/2 x 20s x 8m/s = 80m) 2. Zero acceleration – C (20s x 8m/s = 160m) 3. Accelerated motion, then decelerated motion – D ( 1/2 x 20s x 6m/s = 60m) 4. Deceleration – B ( 1/2 x 20s x 4m/s = 40m) Which line represents the furthest distance? – C Which line represents the least distance? – B
 2. Zero acceleration – C (20s x 8m/s = 160m) 3. Accelerated motion, then decelerated motion – D ( 1/2 x 20s x 6m/s = 60m) 4. Deceleration – B ( 1/2 x 20s x 4m/s = 40m) Which line represents the furthest distance. – C Which line represents the least distance. – B.")
20
Practice Question 2 Describe the motion of the cyclist Work out the initial acceleration Work out the distance travelled by the cyclist in the first 40 seconds

21
Practice Question 2 – Answer Describe the motion of the cyclist – accelerates at constant rate for 40 seconds, then decelerates for the next 20 seconds to a standstill Work out the initial acceleration – 0.2m/s 2 (8m/s ÷ 40s) Work out the distance travelled by the cyclist in the first 40 seconds – ½ x 40s x 8m/s = 160m
 Work out the distance travelled by the cyclist in the first 40 seconds – ½ x 40s x 8m/s = 160m")
22
Practice Question 3 Plot a velocity-time graph of these results What was the initial acceleration? How far did it travel in the first 20 seconds? How far did it travel in the next 10 seconds? In a motorcycle test the speed from rest was recorded at intervals Time (s)051015202530 Velocity (m/s)010203040
 Velocity (m/s)")
23
Practice Question 3 – Answer What was the initial acceleration – 2m/s 2 (40m/s ÷ 20s) How far did it travel in the first 20 seconds – ½ x 20s x 40m/s = 400m How far did it travel in the next 10 seconds – 40 x 10 = 400m
 How far did it travel in the first 20 seconds – ½ x 20s x 40m/s = 400m How far did it travel in the next 10 seconds – 40 x 10 = 400m")
Similar presentations


.>")
