Download presentation
Presentation is loading. Please wait.

1
Health Care Sector Matt Diffley Marc Travis

2
Recommendation Short- Term Short- Term Underweight compared to the S&P Underweight compared to the S&P Currently -1.78% weight Currently -1.78% weight Keep at current weight Keep at current weight Long- Term Long- Term Potential for increased growth Potential for increased growth Overweight in the future Overweight in the future

3
Sector Overview 49 stocks 49 stocks 14.93% of the S&P 500 ( 2 nd largest) 14.93% of the S&P 500 ( 2 nd largest) 1.89% Equipment & Supplies 1.89% Equipment & Supplies 1.81% Providers & Services 1.81% Providers & Services 1.09% Biotechnology 1.09% Biotechnology 10.14% Pharmaceuticals 10.14% Pharmaceuticals Market Cap: $1,210,350.78 Market Cap: $1,210,350.78 Largest Co. : Pfizer, Johnson and Johnson, King, Abbott, Amgen (50%Mkt.) Largest Co. : Pfizer, Johnson and Johnson, King, Abbott, Amgen (50%Mkt.)
 Largest Co. : Pfizer, Johnson and Johnson, King, Abbott, Amgen (50%Mkt.).")
4
Current SIM Stocks MDT Meditronic MDT Meditronic CDH Cardinal Health CDH Cardinal Health ABC AmerisourceBergen ABC AmerisourceBergen AMGN Amgen AMGN Amgen JNJ Johnson and Johnson JNJ Johnson and Johnson

5
Business Analysis Phase of Life Cycle: Growth Phase of Life Cycle: Growth Sector – Growth/ Defensive Sector – Growth/ Defensive Effect of the economic environment? Effect of the economic environment? Perform independently of economic market Perform independently of economic market Steady rate of growth Steady rate of growth

6
External Factors Government Influence Government Influence FDA: standards for releasing new products creates high R&D cost, long time horizon FDA: standards for releasing new products creates high R&D cost, long time horizon Subsidies: affect the direction of research by health care companies Subsidies: affect the direction of research by health care companies

7
Rising Demand Elderly People Elderly People

8
Growing Demand Overweight People Overweight People

10
Sector Concentration Heavily weighted in Pharmaceuticals Heavily weighted in Pharmaceuticals Pharm. Market cap: $822,301.79 ( 68%) Pharm. Market cap: $822,301.79 ( 68%) Pfizer, Johnson & Johnson, Merck, Abbott Pfizer, Johnson & Johnson, Merck, Abbott market cap: $475,047 (44%) market cap: $475,047 (44%)
 Pharm. Market cap: $822, ( 68%) Pfizer, Johnson & Johnson, Merck, Abbott Pfizer, Johnson & Johnson, Merck, Abbott market cap: $475,047 (44%) market cap: $475,047 (44%).")
11
Porter’s Five Forces Barrier to entry: High Barrier to entry: High Cost of R&D, patent limitations Cost of R&D, patent limitations Competition: High Competition: High First mover advantage ( patents) First mover advantage ( patents) Power of supplier: low Power of supplier: low Power of buyer: low Power of buyer: low Substitutes: low Substitutes: low
 First mover advantage ( patents) Power of supplier: low Power of supplier: low Power of buyer: low Power of buyer: low Substitutes: low Substitutes: low")
12
Financial Analysis Gross margins in decline (last 5 years) from 54%- 48.5% Gross margins in decline (last 5 years) from 54%- 48.5% SG&A expenses also in decline. SG&A expenses also in decline. R&D costs relatively stable (6.5-6.8% of sales) R&D costs relatively stable (6.5-6.8% of sales) Net Margins steadily increasing Net Margins steadily increasing Ranging from 9-10% Ranging from 9-10% Earnings per share nearly doubled Earnings per share nearly doubled
 R&D costs relatively stable ( % of sales) Net Margins steadily increasing Net Margins steadily increasing Ranging from 9-10% Ranging from 9-10% Earnings per share nearly doubled Earnings per share nearly doubled.")
13
Financial Analysis Return on Equity shows steady growth Return on Equity shows steady growth

14
Expectations High Growth Sector High Growth Sector Low payouts, dividend yields Low payouts, dividend yields High levels of reinvestment High levels of reinvestment Revenue Growth of 13-14% expected from 2003-2010 Revenue Growth of 13-14% expected from 2003-2010 Earnings Growth of 12.5% Earnings Growth of 12.5% Second highest earnings growth rate of any sector during this 7-year period Second highest earnings growth rate of any sector during this 7-year period Positive earnings surprises in 5 of last 7 quarters Positive earnings surprises in 5 of last 7 quarters

15
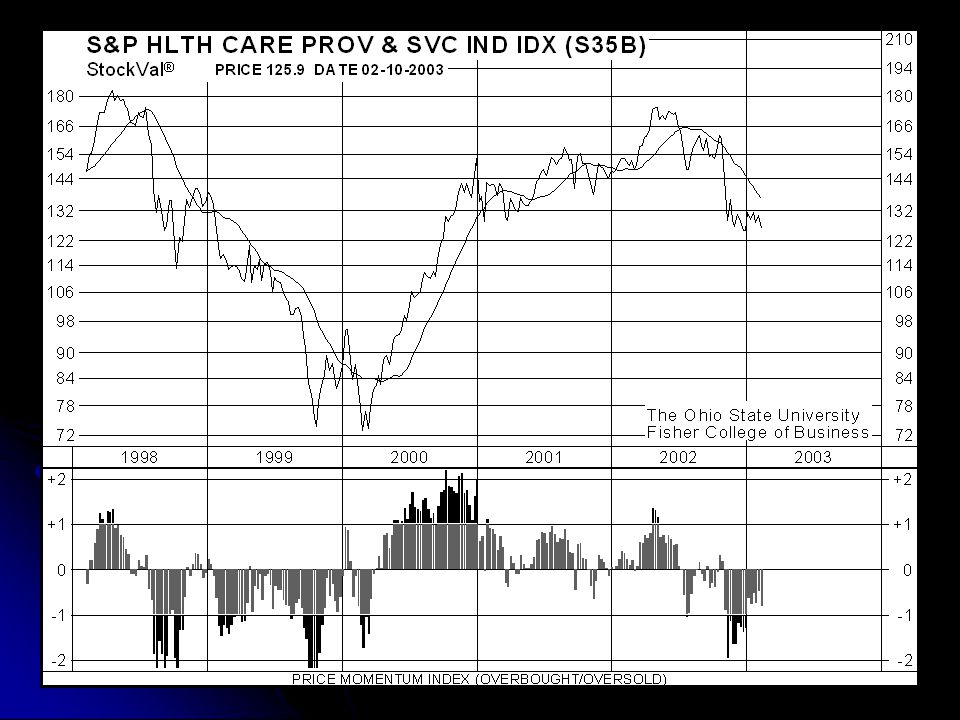
Growth Equipment and Supplies Industry- orange S&P- green Providers and Services Industry- orange S&P- green

16
Growth Biotechnology Amgen- red Industry- orange S&P- green Pharmaceuticals Pfizer- red Industry- orange S&P- green

17
Ratio Analysis S&PSector Equip. &Supplies Providers& Services Biotech.Pharm. P/E23.219.8731.6618.4441.8120.90

18
PE Comparison for Companies Low variance between companies Low variance between companies Providers and Services Providers and Services 19.72- 16.47 19.72- 16.47 Pharmaceuticals Pharmaceuticals 24.05- 17.35 24.05- 17.35 Wide variance between companies Wide variance between companies Equipment and supplies Equipment and supplies 40.97- 13.85 40.97- 13.85 Biotechnology Biotechnology 77.53- 19.08 77.53- 19.08

24
Technical Analysis Upward trend Upward trend Biotechnology Biotechnology Care & Equipment Care & Equipment Pharmaceuticals Pharmaceuticals Downward trend Downward trend Providers & Services Providers & Services Overall upward trend Overall upward trend

25
Overall Evaluation Overweight this sector by 2% Overweight this sector by 2% Business Business Positive potential demand Positive potential demand Porter’s five forces= favorable market position Porter’s five forces= favorable market position Financial Financial Strong earnings growth Strong earnings growth Steadily increasing ROE Steadily increasing ROE Valuation Valuation Upward growth Momentum trend Upward growth Momentum trend Strong relation between PE and momentum Strong relation between PE and momentum

26
Market Prediction Expected S&P growth rate: 10.5% (2003-2010) Expected S&P growth rate: 10.5% (2003-2010) Expected Health Care growth rate: 12.5% (2003-2010 ) Expected Health Care growth rate: 12.5% (2003-2010 ) Only information technology has a higher expected growth rate (12.6%) Only information technology has a higher expected growth rate (12.6%)
 Expected S&P growth rate: 10.5% ( ) Expected Health Care growth rate: 12.5% ( ) Expected Health Care growth rate: 12.5% ( ) Only information technology has a higher expected growth rate (12.6%) Only information technology has a higher expected growth rate (12.6%)")
27
Weighting by Industry Equipment & Supplies Equipment & Supplies Current growth low Current growth low Momentum upward Momentum upward PE high relative to market PE high relative to market Decision: overweight Decision: overweight

28
Weighting by Industry Providers and Services Providers and Services Current growth low Current growth low Momentum stagnant Momentum stagnant PE high in comparison to the S&P PE high in comparison to the S&P Conclusion: Conclusion: Industry overvalued Industry overvalued Underweight this industry Underweight this industry

29
Weighting by Industry Biotechnology Biotechnology Currently low growth Currently low growth Upward momentum Upward momentum Very high PE Very high PE Conclusion Conclusion Earnings will go up Earnings will go up Overweight Overweight

30
Weighting by Industry Pharmaceuticals Pharmaceuticals Low growth Low growth Upward momentum Upward momentum PE even with the market PE even with the market Decision: Decision: Hold the current weighting Hold the current weighting

31
Potential Risks Analysts predict negative future Analysts predict negative future Lowering earnings predictions Lowering earnings predictions Patent Risk: Patent Risk: Majority of large pharmaceuticals will lose patent protection Majority of large pharmaceuticals will lose patent protection Current Growth Rate Current Growth Rate Lower than historical figures Lower than historical figures

32
Questions?

Similar presentations


 Analysts: Chris Landqvist, Justin Pippitt, Kelli Coldiron & Wei Pi.>")


 - Extremely high barriers.>")


>")


