Download presentation
Presentation is loading. Please wait.

1
Construction + Demolition Waste Trends Trends in Construction and Demolition Waste in Oregon AOR Construction and Demolition Recycling Forum March 15, 2012 Peter Spendelow Oregon Department of Environmental Quality

2
Construction + Demolition Waste Trends Construction and demolition waste: waste from construction, renovation, or demolition of: –buildings –roads, and –bridges EPA does not include C&D as part of municipal solid waste (MSW)
")
3
Construction + Demolition Waste Trends Oregon DEQ “Counting Waste” The waste that counts towards wasteshed recovery/disposal rates Includes MSW and some but not all C&D wastes Excludes: Inert materials (rock, concrete, brick, asphalt) Major metal demolition debris
 Major metal demolition debris")
4
Construction + Demolition Waste Trends Composition of Landfilled Waste from 131 C&D Loads in 2009 MaterialPercent Cardboard/Brown Bags 2.19% Rigid Plastic Products 2.04% Wood (total) 28.81% Carpet 4.89% Roofing / Tarpaper 21.08% Flat Window Glass 1.15% Other Ferrous Metal 2.75% Rock / Concrete / Brick 4.99% Gypsum Wallboard 11.26% Fiberglass Insulation 2.50% Other Inorganics 5.82% Total: Above Materials 87.47%
 28.81% Carpet 4.89% Roofing / Tarpaper 21.08% Flat Window Glass 1.15% Other Ferrous Metal 2.75% Rock / Concrete / Brick 4.99% Gypsum Wallboard 11.26% Fiberglass Insulation 2.50% Other Inorganics 5.82% Total: Above Materials 87.47%")
5
Construction + Demolition Waste Trends Amount of C&D Waste Disposed (low end) Tons % C&D LoadsC&D Tons Route trucks1,359,6980.0%0 Compacting boxes180,2552.5%4,506 Loose boxes256,54415.8%40,620 Self-haul613,19545.3%278,048 Dirty MRF residue186,64758.6%109,322 Total2,596,34016.7%432,496 Excludes inerts and other non-counting waste. These are very rough estimates.

6
Construction + Demolition Waste Trends Amount of C&D Waste Disposed by Type (low end) Tons% All Loads % C&D Loads Demolition77,5343.0%17.9% New Construction80,2463.1%18.6% Renovation274,71510.6%63.5% Total432,49616.7%100.0% Excludes inerts and other non-counting waste. These are very rough estimates.

7
Construction + Demolition Waste Trends C&D Materials in Disposed Waste Substreams Source: 2009/ 2010 waste composition studyRoute Trucks Compacting Boxes Loose BoxesSelf-haul Dirty MRFsTotal Cardboard2.48%5.73%2.84%2.70%2.27%2.80% Rigid plastic products3.54%4.08%5.29%4.91%5.53%4.13% All Wood3.12%9.33%19.15%22.57%13.45%11.10% Carpet, Rugs, fiber pads1.15%0.08%6.82%5.35%4.59%2.64% Asphalt roofing & tarpaper0.19%0.10%4.32%6.25%18.95%3.90% Flat window glass0.05%0.03%0.47%1.02%0.41%0.39% Other ferrous metal1.22%2.90%2.95%3.06%2.02%1.98% Rock, concrete, brick0.41%0.46%0.66%2.04%3.35%1.33% Gypsum wallboard0.35%0.42%2.96%5.21%9.60%2.83% Fiberglass Insulation0.11%0.05%2.00%1.21%1.45%0.55% Other miscellaneous inorganics1.13%1.11%1.22%2.98%3.84%2.04% Total without cardboard, plastics7.75%14.47%40.56%49.68%57.66%26.76%

8
Construction + Demolition Waste Trends Tons of C&D Material Disposed & Recovered Material Tons disposed Percent of total disposal 2009 recovery 2010 recovery 2009 recovery rate Cardboard72,6122.8%367,536368,60283.5% Rigid plastic products107,1024.1%11,12210,983 All Wood288,24811.1%307,005340,79451.6% Carpet, Rugs, fiber pads68,4622.6%5151,6410.7% Asphalt roofing & tarpaper101,1893.9%7,83015,8037.2% Window glass10,1350.4%7098676.5% Other ferrous metal51,4112.0%332,781368,249 Rock, concrete, brick34,5751.3%not available Gypsum wallboard73,5602.8%3,3383,2614.3% Fiberglass Insulation14,2160.5%0 0.0% Other miscellaneous inorganics52,8722.0%not available Paint3,1710.1%1,3081,93129.2% Total excluding cardboard, plastic697,83826.9%

9
Construction + Demolition Waste Trends Most environmental impact comes from production/upstream, not recycling/demolition/end-of-life Harvesting of trees, minerals, other raw materials Energy use in production/manufacture of materials But much (most?) of the impact also comes from the use of the building: energy used in heating, cooling
 of the impact also comes from the use of the building: energy used in heating, cooling")
10
Construction + Demolition Waste Trends Value of recycling a material based on: the environmental impacts of the material being replaced, minus the net environmental impact of collecting and processing the material for recycling

11
Construction + Demolition Waste Trends Greenhouse Gas Impacts of Making and Recycling Concrete MTCE per ton 0.0009Making aggregate from virgin rock 0.0006Making aggregate from concrete 0.0003Difference = GHG savings from recycling 0.033Making concrete itself Source: EPA WAste Reduction Model (WARM) for recycling data
 for recycling data")
12
Greenhouse Gas Savings from Recycling Materials “ Break-Even Point” is where GHG emissions transporting the recyclables equals GHG emissions avoided when the recyclables displace virgin feedstocks. Avoided disposal-related emissions are not included. MaterialProduction & Forestry Savings Break-Even Point (miles) MTCE/ton collectedTruckRailFreighter Aluminum3.44116,000451,000524,000 Corrugated Cardboard0.7927,000104,000120,000 Newspaper0.6823,00090,000104,000 Steel0.4816,00063,00073,000 LDPE0.3612,00047,00055,000 HDPE0.3010,00039,00045,000 Glass (to bottles)0.072,0009,00011,000 Concrete (to aggregate)0.0003103946
 MTCE/ton collectedTruckRailFreighter Aluminum ,000451,000524,000 Corrugated Cardboard0.7927,000104,000120,000 Newspaper0.6823,00090,000104,000 Steel0.4816,00063,00073,000 LDPE0.3612,00047,00055,000 HDPE0.3010,00039,00045,000 Glass (to bottles)0.072,0009,00011,000 Concrete (to aggregate)")
13
Construction + Demolition Waste Trends National Concrete Tonnage: 2007 919,000,000 Tons of concrete produced 200,000,000 Tons of waste concrete generated (demolition) 50 – 60% Crude estimate of percent concrete waste recycled Source: EPA WARM background document http://www.epa.gov/climatechange/wycd/waste/downloads/Concrete.pdf
 50 – 60% Crude estimate of percent concrete waste recycled Source: EPA WARM background document")
14
Construction + Demolition Waste Trends Greenhouse Gas Savings of Asphalt Roofing Recycling and Combustion MTCE per ton 0.025Recycling into road asphalt 0.093Energy recovery in cement kiln (theoretical) -0.011Landfilling MTCE per ton -0.009Recycling into wallboard & soil amendment -0.035Landfilling Greenhouse Gas Savings of Wallboard Recycling
 Landfilling MTCE per ton Recycling into wallboard & soil amendment Landfilling Greenhouse Gas Savings of Wallboard Recycling")
15
Construction + Demolition Waste Trends Other hazards: Toxins in C & D Asbestos Lead pipe Lead paint Mercury Glues and solvents in construction

16
Construction + Demolition Waste Trends Per Capita Disposed Waste from Oregon 1993-2010 (all “counting” waste: lbs/person-year)
")
17
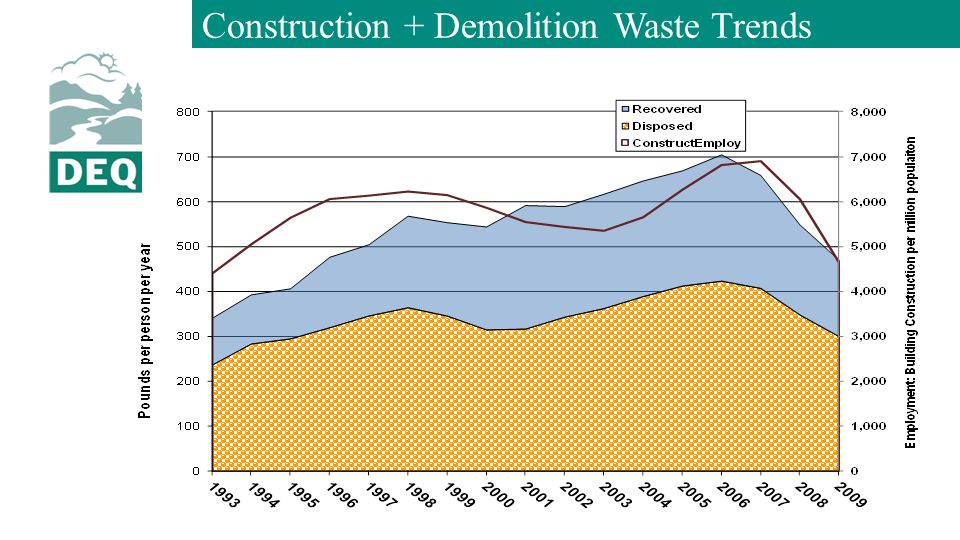
Construction + Demolition Waste Trends

22
Summary DEQ tracks disposal and recovery of many C&D materials, but not inerts or major metal demolition Most environmental impact comes from the production and use of construction materials, not end-of-life Because of shear volume, C&D materials are important. Strong decline in C&D waste generation in 2007- 2010 due to less construction activity

Similar presentations