Download presentation
Presentation is loading. Please wait.

1
146 th CFMC Meeting held June 24, 2013 SSC Meeting held June 19 – 20, 2013

2
SEDAR 30: Assessed blue tang and queen triggerfish TIP data from 1981 - 2011 Juvenile blue tang Acanthurus coeruleus Queen triggerfish Balistes vetula L. Johnson, Fishbase Barbara Kojis

3
School of primarily blue tang at Buck Island St. Croix, USVI

4
Goal of SEDAR 30 Determine stock status for blue tang and queen triggerfish Given data limitations abundance could not be determined Conducted mean length analyses to evaluate stock status in terms of mortality U.S. Department of Commerce | National Oceanic and Atmospheric Administration | NOAA Fisheries | Page 4

5
Data sources reviewed during SEDAR 30 Marine Recreational Fisheries Statistics Survey (MRFSS) Puerto Rico only Commercial landings By island platform and gear Trip Interview Program (TIP) Life history information Published literature U.S. Department of Commerce | National Oceanic and Atmospheric Administration | NOAA Fisheries | Page 5

6
MRFSS in Puerto Rico Blue tang Five intercepted trips that retained or indicated discarding blue tang Two length measurements Queen triggerfish Less than 20 intercepted trips per year retained or discarded queen triggerfish Sixty length measurements Was not used for assessment U.S. Department of Commerce | National Oceanic and Atmospheric Administration | NOAA Fisheries | Page 6

7
Commercial landings USVI 1974-1995 - catch reported as snapper/grouper or finfish 1997 – reported to species group Surgeonfishes Triggerifshes Puerto Rico Species specific Known problems with under-reporting Commercial landings were not used for assessment U.S. Department of Commerce | National Oceanic and Atmospheric Administration | NOAA Fisheries | Page 7

12
Trip Interview Program – Blue tang U.S. Department of Commerce | National Oceanic and Atmospheric Administration | NOAA Fisheries | Page 12 IslandGear type Number of Samples Number of years sampled Average number of samples per year -Pots & traps621- Puerto RicoHook & line111 Puerto RicoNets121620.2 Puerto RicoPots & traps1963.2 St. Thomas/ St JohnHook & line21210.5 St. Thomas/ St JohnNets2237.33 St. Thomas/ St JohnPots & traps299621142.6 St. CroixHook & line90330 St. CroixNets14621597.5 St. CroixPots & traps32220291111

13
Trip Interview Program – Queen triggerfish IslandGear type Number of Samples Number of years sampled Average # of samples per year -Pots & traps1222- Puerto Rico Dive/Spear/By Hand10112638.8 Puerto RicoHook & line9332833.3 Puerto RicoNets11572644.5 Puerto RicoPots & traps491728175.6 St. Thomas/St John Dive/Spear/By Hand616 St. Thomas/St JohnHook & line2971224.75 St. Thomas/St JohnNets221 St. Thomas/St JohnPots & traps773121368.14 St. Croix Dive/Spear/By Hand6441253.67 St. CroixHook & line3131226.08 St. CroixNets3775.28 St. CroixPots & traps802528286.61

14
Mean length analysis Length-frequency data were adequate for the pot and trap fisheries for both species Except in Puerto Rico for blue tang Used the Gedamke-Hoenig mean length estimator to obtain estimates of total mortality and evaluate how mortality has changed over time U.S. Department of Commerce | National Oceanic and Atmospheric Administration | NOAA Fisheries | Page 14

15
Mean length analysis U.S. Department of Commerce | National Oceanic and Atmospheric Administration | NOAA Fisheries | Page 15

16
Mean length analysis Beverton-Holt mean length mortality estimator U.S. Department of Commerce | National Oceanic and Atmospheric Administration | NOAA Fisheries | Page 16 length at which all animals are fully vulnerable to gear mean lengthtotal mortality growth rate maximum length

17
TIP length-frequency data – blue tang U.S. Department of Commerce | National Oceanic and Atmospheric Administration | NOAA Fisheries | Page 17 N = 860 N = 498 N =223 N = 66 N = 499 N = 840

18
TIP length-frequency data – blue tang U.S. Department of Commerce | National Oceanic and Atmospheric Administration | NOAA Fisheries | Page 18 N = 13201 N = 3340 N =11771 N = 2104 N = 629 N = 1175

19
TIP length-frequency data – queen triggerfish U.S. Department of Commerce | National Oceanic and Atmospheric Administration | NOAA Fisheries | Page 19 N = 2631 N = 323 N =1062 N = 536 N = 37 N =328

20
TIP length-frequency data – queen triggerfish U.S. Department of Commerce | National Oceanic and Atmospheric Administration | NOAA Fisheries | Page 20 N = 2224 N = 876 N =495 N = 276 N = 3221 N =638

21
TIP length-frequency data – queen triggerfish U.S. Department of Commerce | National Oceanic and Atmospheric Administration | NOAA Fisheries | Page 21 N = 3919 N = 888 N = 2168 N = 757 N = 199 N =94

22
Blue tang life history information U.S. Department of Commerce | National Oceanic and Atmospheric Administration | NOAA Fisheries | Page 22 Length -age L t = L ∞ (1-e K(t- to) ) Location t max (years)L max (mm)L∞L∞ Ktoto nSource San Blas 16-183 SL0.477-0.310110Choat and Robertson (2002) Belize 15242 FL188 FL1.030-0.15092Mutz (2006) Los Roques 20285 FL199 FL0.390-0.11281Mutz (2006) Margarita 20335 FL---74Mutz (2006) San Blas 16261 FL231 FL0.490 ‐ 0.251 110Mutz (2006) Asencion 37-193 FL0.403--Choat and Robertson (2002) Lee Stocking 27-174 FL0.817--Choat and Robertson (2002) Asencion 37304 FL244 FL0.420-0.092112Mutz (2006) Bermuda 43250 FL203 FL1.010-0.412105Mutz (2006) Lee Stocking 27256 FL219 FL0.880-0.41977Mutz (2006)
 ) Location t max (years)L max (mm)L∞L∞ Ktoto nSource San Blas SL Choat and Robertson (2002) Belize FL188 FL Mutz (2006) Los Roques FL199 FL Mutz (2006) Margarita FL---74Mutz (2006) San Blas FL231 FL0.490 ‐ Mutz (2006) Asencion FL Choat and Robertson (2002) Lee Stocking FL Choat and Robertson (2002) Asencion FL244 FL Mutz (2006) Bermuda FL203 FL Mutz (2006) Lee Stocking FL219 FL Mutz (2006).")
23
Blue tang growth curves U.S. Department of Commerce | National Oceanic and Atmospheric Administration | NOAA Fisheries | Page 23

24
Queen triggerfish life history information U.S. Departmen t of Commerce | National Oceanic and Atmospher ic Administra tion | NOAA Fisheries | Page 24 Length -age L t = L ∞ (1-e K(t- to) ) Location t max (years) L max (mm)L∞L∞ Ktoto nSource Jamaica-447 FL-0.570--Aiken (1975) PR-546 FL---- Bohnsack and Harper (1988) STT & STJ-465 FL---- Bohnsack and Harper (1988) PR & USVI7-415 FL0.300-0.600494 Manooch and Drennon (1987) PR-760 FL----Pagán 2002 St. John-385 FL----Randall (1962) USVI-572 FL----Randall (1968) Brazil14460 FL441 FL0.140-1.800476de Albuquerque et al. (2011) south Florida-425 FL---- Bohnsack and Harper (1988) Brazil-450 FL----Menezes (1979)
 ) Location t max (years) L max (mm)L∞L∞ Ktoto nSource Jamaica-447 FL Aiken (1975) PR-546 FL---- Bohnsack and Harper (1988) STT & STJ-465 FL---- Bohnsack and Harper (1988) PR & USVI7-415 FL Manooch and Drennon (1987) PR-760 FL----Pagán 2002 St. John-385 FL----Randall (1962) USVI-572 FL----Randall (1968) Brazil14460 FL441 FL de Albuquerque et al. (2011) south Florida-425 FL---- Bohnsack and Harper (1988) Brazil-450 FL----Menezes (1979).")
25
Queen triggerfish growth curves U.S. Department of Commerce | National Oceanic and Atmospheric Administration | NOAA Fisheries | Page 25

26
Mean length analysis Model is run first assuming no change in mortality and then with increased complexity Sensitivity analysis was conducted to characterize uncertainty in the mortality estimates U.S. Department of Commerce | National Oceanic and Atmospheric Administration | NOAA Fisheries | Page 26

27
Blue tang, St. Thomas U.S. Department of Commerce | National Oceanic and Atmospheric Administration | NOAA Fisheries | Page 27 L c = 19cm, L ∞ = 23.1cm, K = 0.49 Z 1983 = 0.09 Z 1984-2010 = 0.4

28
Comparison of fishing mortality and natural mortality Blue tang, St. Thomas/St. John U.S. Department of Commerce | National Oceanic and Atmospheric Administration | NOAA Fisheries | Page 28 Frequency Cumulative percent F/M

29
Comparison of fishing mortality and natural mortality Blue tang, St. Croix U.S. Department of Commerce | National Oceanic and Atmospheric Administration | NOAA Fisheries | Page 29 Frequency Cumulative percent F/M

30
Queen triggerfish, Puerto Rico U.S. Departmen t of Commerce | National Oceanic and Atmospher ic Administra tion | NOAA Fisheries | Page 30 L c = 29cm, L ∞ = 41.5cm, and K = 0.3y -1

31
Comparison of fishing mortality and natural mortality Queen triggerfish, Puerto Rico U.S. Department of Commerce | National Oceanic and Atmospheric Administration | NOAA Fisheries | Page 31 Frequency Cumulative percent F/M

32
Queen triggerfish, St. Thomas/St. John U.S. Department of Commerce | National Oceanic and Atmospheric Administration | NOAA Fisheries | Page 32 L c = 34cm, L ∞ = 41.5cm, and K = 0.3y -1

33
Comparison of fishing mortality and natural mortality Queen triggerfish, St. Thomas/St. John U.S. Department of Commerce | National Oceanic and Atmospheric Administration | NOAA Fisheries | Page 33 Frequency Cumulative percent F/M

34
Queen triggerfish, St. Croix U.S. Department of Commerce | National Oceanic and Atmospheric Administration | NOAA Fisheries | Page 34 L c = 28cm, L ∞ = 41.5cm, and K = 0.3y -1 Z = 0.7 Z = 1.07

35
Comparison of fishing mortality and natural mortality Queen triggerfish, St. Croix U.S. Department of Commerce | National Oceanic and Atmospheric Administration | NOAA Fisheries | Page 35 Frequency Cumulative percent F/M

36
Main conclusions from AW report for blue tang: Puerto Rico The AW panel decided that data was insufficient to conduct length-based analysis. St. Thomas / St. John Results from length-based analysis suggests that total mortality increased, Year of change and magnitude of change was variable among the sensitivity runs. Uncertainty about whether fishing mortality is higher than natural mortality (i.e., proxy for F MSY ). Annual length-frequency data have been relatively stable over the time series. St. Croix Results from length-based analysis suggests that total mortality increased in 1983 (first year of available data), Magnitude of change was variable and dependent on parameter inputs. Uncertainty about whether fishing mortality is higher than natural mortality (i.e., proxy for F MSY ). Annual length-frequency data have been stable between 1984-2012. Puerto Rico The AW panel decided that data was insufficient to conduct length-based analysis. St. Thomas / St. John Results from length-based analysis suggests that total mortality increased, Year of change and magnitude of change was variable among the sensitivity runs. Uncertainty about whether fishing mortality is higher than natural mortality (i.e., proxy for F MSY ). Annual length-frequency data have been relatively stable over the time series. St. Croix Results from length-based analysis suggests that total mortality increased in 1983 (first year of available data), Magnitude of change was variable and dependent on parameter inputs. Uncertainty about whether fishing mortality is higher than natural mortality (i.e., proxy for F MSY ). Annual length-frequency data have been stable between 1984-2012. U.S. Departmen t of Commerce | National Oceanic and Atmospher ic Administra tion | NOAA Fisheries | Page 36
. Annual length-frequency data have been relatively stable over the time series. St. Croix Results from length-based analysis suggests that total mortality increased in 1983 (first year of available data), Magnitude of change was variable and dependent on parameter inputs. Uncertainty about whether fishing mortality is higher than natural mortality (i.e., proxy for F MSY ). Annual length-frequency data have been stable between Puerto Rico The AW panel decided that data was insufficient to conduct length-based analysis. St. Thomas / St. John Results from length-based analysis suggests that total mortality increased, Year of change and magnitude of change was variable among the sensitivity runs. Uncertainty about whether fishing mortality is higher than natural mortality (i.e., proxy for F MSY ). Annual length-frequency data have been relatively stable over the time series. St. Croix Results from length-based analysis suggests that total mortality increased in 1983 (first year of available data), Magnitude of change was variable and dependent on parameter inputs. Uncertainty about whether fishing mortality is higher than natural mortality (i.e., proxy for F MSY ). Annual length-frequency data have been stable between U.S. Departmen t of Commerce | National Oceanic and Atmospher ic Administra tion | NOAA Fisheries | Page 36.")
37
Main conclusions from AW report for blue tang: General conclusions Available age-growth relationships suggest two possible explanations of growth (k = 0.4 or k = 0.8-1) adding to the uncertainty surrounding the mortality estimates Well-designed growth studies are needed for this species Age-growth relationship erodes at an early age relative to the blue tang life span Length analysis may be inappropriate for this species Collection of catch-at-age data may be more appropriate to adequately describe changes in blue tang population structure. General conclusions Available age-growth relationships suggest two possible explanations of growth (k = 0.4 or k = 0.8-1) adding to the uncertainty surrounding the mortality estimates Well-designed growth studies are needed for this species Age-growth relationship erodes at an early age relative to the blue tang life span Length analysis may be inappropriate for this species Collection of catch-at-age data may be more appropriate to adequately describe changes in blue tang population structure. U.S. Departmen t of Commerce | National Oceanic and Atmospher ic Administra tion | NOAA Fisheries | Page 37
 adding to the uncertainty surrounding the mortality estimates Well-designed growth studies are needed for this species Age-growth relationship erodes at an early age relative to the blue tang life span Length analysis may be inappropriate for this species Collection of catch-at-age data may be more appropriate to adequately describe changes in blue tang population structure. U.S. Departmen t of Commerce | National Oceanic and Atmospher ic Administra tion | NOAA Fisheries | Page 37.")
38
Main conclusions from AW report for queen triggerfish: Puerto Rico Results from length analysis suggest that total mortality declined in 1998 or 1999, An increase in mean length can be due to reduction in mortality or expansion to relatively unfished areas. Without detailed spatial catch data, it is difficult to separate these effects Uncertainty about whether fishing mortality is higher than natural mortality (i.e., proxy for F MSY ). USVI Results from length analysis suggest that mortality has remained unchanged in St. Thomas/ St. John over time and increased in St. Croix in 1985 or 1986. Industry representatives indicated that they release queen triggerfish >45cm. Violates model assumption of knife-edge selectivity Makes it difficult to interpret absolute mortality estimates General conclusions Available life history information suggested two different life strategies for queen triggerfish Age and growth studies are needed Puerto Rico Results from length analysis suggest that total mortality declined in 1998 or 1999, An increase in mean length can be due to reduction in mortality or expansion to relatively unfished areas. Without detailed spatial catch data, it is difficult to separate these effects Uncertainty about whether fishing mortality is higher than natural mortality (i.e., proxy for F MSY ). USVI Results from length analysis suggest that mortality has remained unchanged in St. Thomas/ St. John over time and increased in St. Croix in 1985 or 1986. Industry representatives indicated that they release queen triggerfish >45cm. Violates model assumption of knife-edge selectivity Makes it difficult to interpret absolute mortality estimates General conclusions Available life history information suggested two different life strategies for queen triggerfish Age and growth studies are needed U.S. Departmen t of Commerce | National Oceanic and Atmospher ic Administra tion | NOAA Fisheries | Page 38
. USVI Results from length analysis suggest that mortality has remained unchanged in St. Thomas/ St. John over time and increased in St. Croix in 1985 or Industry representatives indicated that they release queen triggerfish >45cm. Violates model assumption of knife-edge selectivity Makes it difficult to interpret absolute mortality estimates General conclusions Available life history information suggested two different life strategies for queen triggerfish Age and growth studies are needed Puerto Rico Results from length analysis suggest that total mortality declined in 1998 or 1999, An increase in mean length can be due to reduction in mortality or expansion to relatively unfished areas. Without detailed spatial catch data, it is difficult to separate these effects Uncertainty about whether fishing mortality is higher than natural mortality (i.e., proxy for F MSY ). USVI Results from length analysis suggest that mortality has remained unchanged in St. Thomas/ St. John over time and increased in St. Croix in 1985 or Industry representatives indicated that they release queen triggerfish >45cm. Violates model assumption of knife-edge selectivity Makes it difficult to interpret absolute mortality estimates General conclusions Available life history information suggested two different life strategies for queen triggerfish Age and growth studies are needed U.S. Departmen t of Commerce | National Oceanic and Atmospher ic Administra tion | NOAA Fisheries | Page 38.")
39
SSC’s Review of SEDAR 30 The SSC accepted the results for queen triggerfish and blue tang as the best available at this time recognizing the following limitations: Lack of life history information Low information content provided by the length frequency data for blue tang because of its determinant growth Potential violation of model assumptions because of dome shaped selectivity for queen triggerfish in STT/STJ due to discards of large fish Uncertainty in the data due to inconsistencies in annual sample size and non- randomness of samples Inability to address biomass benchmarks due to considerable uncertainty in landings data

40
Conclusions - Queen triggerfish The SSC concluded that the results of SEDAR 30 are consistent with the current status determination in PR and STT/STJ, which is that queen triggerfish is not undergoing overfishing. However, the result for STX indicates that overfishing might be occurring.

41
Conclusions - Blue Tang Results were too uncertain to be used for status determination Blue tang does not appear to be targeted in PR based on lack of reported landings Given the above, the SSC finds no basis for changing the ABCs for queen triggerfish and blue tang.

42
Recommendatons For blue tang length analysis is not appropriate and the SSC recommends collecting catch at age data to inform an age-structure model. For the queen triggerfish in St. Croix, the SSC recommends that approximately 500 length measurements be taken within the next year to inform further analysis. There is an urgent need for local age and life history parameters for the two species. Without the basic life history and age information, the assessments will continue not to be very informative for scientific advice and management. The SSC understands that a new collection of otoliths is under way and recommends that a carefully designed sampling protocol be implemented. Validation of catch data including expansion factors is also urgently needed.

43
Derivation of fishing mortality-based references points and the determination of overfishing status of queen snapper and silk snapper captured in the US Caribbean June 19, 2013 SEFSC Miami, Florida

44
Review of SEDAR 26 Assessed species Queen snapper, Etelis oculatus Silk snapper, Lutjanus vivanus Island platforms and gear types were assessed separately Queen snapper Puerto Rico, hook and line St. Croix, hook and line Silk snapper St. Croix, hook and line D. Bryan, FishBase.org T. Meyer, FishBase.org

45
Review of SEDAR 26 Data Trip Interview Program (TIP) Annual length data Most consistent species-specific data among the platforms
 Annual length data Most consistent species-specific data among the platforms")
48
Review of SEDAR 26 Gedamke-Hoenig mean length estimator Computationally attractive for data limited situations – Minimal data inputs Length-frequency data – Mean length and length-at-full recruitment Life-history parameters – von Bertalanffy growth parameters Provides estimates of total mortality Fishing mortality can be derived from total mortality and estimates of natural mortality Does not assume population is at equilibrium Estimates temporal changes in total mortality

49
Review of SEDAR 26 Uncertainty in assessment Life history parameters were highly uncertain Sensitivity analysis was conducted Conducted assessment over a range of the input parameters

50
SEDAR 26 Assessment Conclusions Queen snapper, hook and line fishery in St. Croix No evidence to suggest overfishing

51
SEDAR 26 Assessment conclusions Silk snapper, hook and line fishery in St. Croix Temporal changes in total mortality were not statistically supported Low sample size in more recent years obscured the relationship between change in size and change in mortality

52
Silk Snapper St. Croix Hook and Line N=158 N=2985 N= 373 N=133 N=31 N=515 N=1775 Fork length (10mm bins) Frequency 1983-1987 1988-1992 1993-1998 1999-2002 2003-2007 2008-2011 All years
 Frequency All years.")
53
SEDAR 26 Assessment Conclusions Queen snapper, hook and line fishery Puerto Rico No evidence to suggest overfishing Proportional change in total mortality was estimated to be less than 1 Fishing mortality less than Fmsy Required assumptions: First year of data collection represents the start (or close to the start) of the fishery and Initial estimate of total mortality is equal to natural mortality (Z~M) Fmsy ~ M
 of the fishery and Initial estimate of total mortality is equal to natural mortality (Z~M) Fmsy ~ M")
54
Per recruit analysis Goals of analysis: Derive fishing mortality reference points F max – maximum of the yield per recruit (YPR) curve F 0.1 - slope of YPR curve that is 10% of the slope at the origin F 30% - F that allows survival of 30% of spawning biomass per recruit Compare reference points to currents fishing mortality estimates Re-evaluate overfishing status Compare to estimates of current fishing mortality to reference points and determine probability of fishery experiencing overfishing Derived from estimates of current total mortality from the sensitivity analysis and estimates of natural mortality (F = Z - M)
 curve F slope of YPR curve that is 10% of the slope at the origin F 30% - F that allows survival of 30% of spawning biomass per recruit Compare reference points to currents fishing mortality estimates Re-evaluate overfishing status Compare to estimates of current fishing mortality to reference points and determine probability of fishery experiencing overfishing Derived from estimates of current total mortality from the sensitivity analysis and estimates of natural mortality (F = Z - M)")
55
Per recruit reference points F0.1 Fmax & F30% Spawning Biomass per Recruit Yield per Recruit Fishing mortality YPRSBPR

56
Per recruit analysis Goals of analysis: Derive fishing mortality reference points F max – maximum of the yield per recruit (YPR) curve F 0.1 - slope of YPR curve that is 10% of the slope at the origin F 30% - F that allows survival of 30% of spawning biomass per recruit Compare current fishing mortality estimates to reference points and determine the probability of fishery experiencing overfishing Derived from estimates of current total mortality from the sensitivity analysis and estimates of natural mortality (F = Z - M)
 curve F slope of YPR curve that is 10% of the slope at the origin F 30% - F that allows survival of 30% of spawning biomass per recruit Compare current fishing mortality estimates to reference points and determine the probability of fishery experiencing overfishing Derived from estimates of current total mortality from the sensitivity analysis and estimates of natural mortality (F = Z - M)")
57
Age schedule and model assumptions

58
Probability of overfishing Queen snapper, hook and line fishery in Puerto Rico 100 80 60 40 20 0 Cumulative percent Fcur/F0.1 0.0 0.5 1.0 1.5 2.0 2.5 3.0 3.5 35 30 25 20 15 10 5 Frequency 0

59
Probability of overfishing Queen snapper, hook and line fishery in Puerto Rico 100 80 60 40 20 0 Cumulative percent Fcur/Fmax 0.0 0.5 1.0 1.5 35 30 25 20 15 10 5 0 Frequency

60
Probability of overfishing Queen snapper, hook and line fishery in Puerto Rico 100 80 60 20 0 Cumulative percent Fcur/F30% 0.0 0.1 0.2 0.3 0.4 0.5 25 20 15 10 5 0 40 Frequency

61
Probability of overfishing Queen snapper, hook and line fishery in St. Croix 100 80 60 40 20 0 30 Fcur/F0.1 1 2 3 4 5 Cumulative percent 25 20 15 10 5 0 Frequency 35

62
Probability of overfishing 100 80 60 40 20 0 Fcur/Fmax Cumulative percent Frequency 50 40 30 20 10 0 Queen snapper, hook and line fishery in St. Croix 0.0 0.5 1.0 1.5 2.0 2.5

63
Probability of overfishing Queen snapper, hook and line fishery in St. Croix 100 80 60 20 0 Cumulative percent Frequency Fcur/F30% 0.0 0.5 1.0 1.5 2.0 2.5 40 30 20 10 0

64
Probability of overfishing Silk snapper, hook and line fishery in St. Croix 100 80 60 40 20 0 Cumulative percent 8 6 4 2 0 Frequency 0 1 2 3 4 Fcur/F0.1

65
Probability of overfishing Silk snapper, hook and line fishery in St. Croix 100 80 60 40 20 0 Cumulative percent 0.0 0.5 1.0 1.5 Fcur/Fmax Frequency 30 20 10 0

66
Probability of overfishing Silk snapper, hook and line fishery in St. Croix 100 80 60 40 20 0 Cumulative percentFrequency 10 8 6 4 2 0 0.0 1.0 2.0 3.0 Fcur/F30%

67
Conclusions Interpretation of overfishing status varied among the reference points Analysis highly dependent on the input value of the von Bertalanffy growth coefficient through the derivations Age-at-recruitment Natural mortality Used to derive fishing mortality from estimates of total mortality Used to derive survivorship-at-age

68
SSC Review of SEDAR 26 and New Approach Estimates of current F were derived from a specific time period that at least in the case of queen snapper is not consistent with the years used to calculate average catch. The available evidence indicates that overfishing probably has not occurred through 2008 and the queen snapper were probably not overfished. The current status of the stock is unknown since the most recent length frequency data included in the assessment was 2008 data. A true harvest control rule is not possible as no reliable estimates of biomass exist and the approach presented is approximately a constant F scenario. Adjusting the current ABC (Allowable Biological Catch) by any ratio assumes that existing average catch derived ABC is appropriate.
 by any ratio assumes that existing average catch derived ABC is appropriate..")
69
Discussion and Recommendations The SSC recognized the uncertainty in methodology due to uncertainty in life history parameters. The SSC RECOMMENDS that regional age-growth studies be conducted. For queen snapper, otoliths are already in storage and should be analyzed as soon as possible. The SSC RECOMMENDS that the most recent length based data be included in the mean length analysis aspect of the approach. Ideally, if ratios were to be used to modify OFL’s then the time period for average landings should correspond to the time period for the mean length analysis. However, this presumes the landings data are reliable. The SSC looked at years used to calculate average catch and found that slightly different time series had little effect on the value for average catch which corresponds to OFL.

70
The SSC spent most of first day discussing the expanded landings data for PR and the extremely high variability that has been observed in recent years. A number of members believed the high fluctuations are not a reflection of reality. The SSC strongly recommends that expansion factors be evaluated again and that reported landings alone be evaluated. Discussion and Recommendations continued

71
The SSC is concerned that reporting for Queen Snapper has changed and that reporting behavior is driving the recent overages. Implications: Fishers could have harvested more in the past so the current OFL is too low, or alternatively that current harvest rates are higher than expected and status is unknown. It was noted that, according to a Federal Register notice, the SEFSC needs to determine if overages result from a situation where “data collection and monitoring improved rather than because catches actually increased.” Apparently, the SEFSC concluded that data collection and monitoring had not improved and that catches actually increased, but the SSC understands that tracking the number of reporting fishers or individual/representative fishers over the recent time period hasn’t been presented. RECOMMENDATION: Reporting behavior and validation of landings needs to be studied and tracked over time to be able to adequately evaluate the difference between overages and changes in reporting.

72
Discussion and Recommendations continued The SSC recalls that the ACL was based on an average catch during a reference period and adjusted by a coefficient of 0.85 because the stock was considered to be undergoing overfishing. A coefficient of 0.9 was used for stocks for which overfishing was not occurring. In light of our current assessment, the later coefficient (0.9) might be more appropriate. SUMMARY statement: Both the SEDAR 26 results and the information presented from the new methodology suggests that overfishing is not occurring, although the assessment is too uncertain to be confident, and there isn’t much room for further development of the fishery. (It was pointed out that the analysis shows some probability that overfishing is occurring.) The SSC is concerned about the reliability of expanded catch data and uncertainty in life history estimates. The SSC concluded that at this time there was no scientific basis for modifying the ABC.
 might be more appropriate. SUMMARY statement: Both the SEDAR 26 results and the information presented from the new methodology suggests that overfishing is not occurring, although the assessment is too uncertain to be confident, and there isn’t much room for further development of the fishery. (It was pointed out that the analysis shows some probability that overfishing is occurring.) The SSC is concerned about the reliability of expanded catch data and uncertainty in life history estimates. The SSC concluded that at this time there was no scientific basis for modifying the ABC..")
Similar presentations


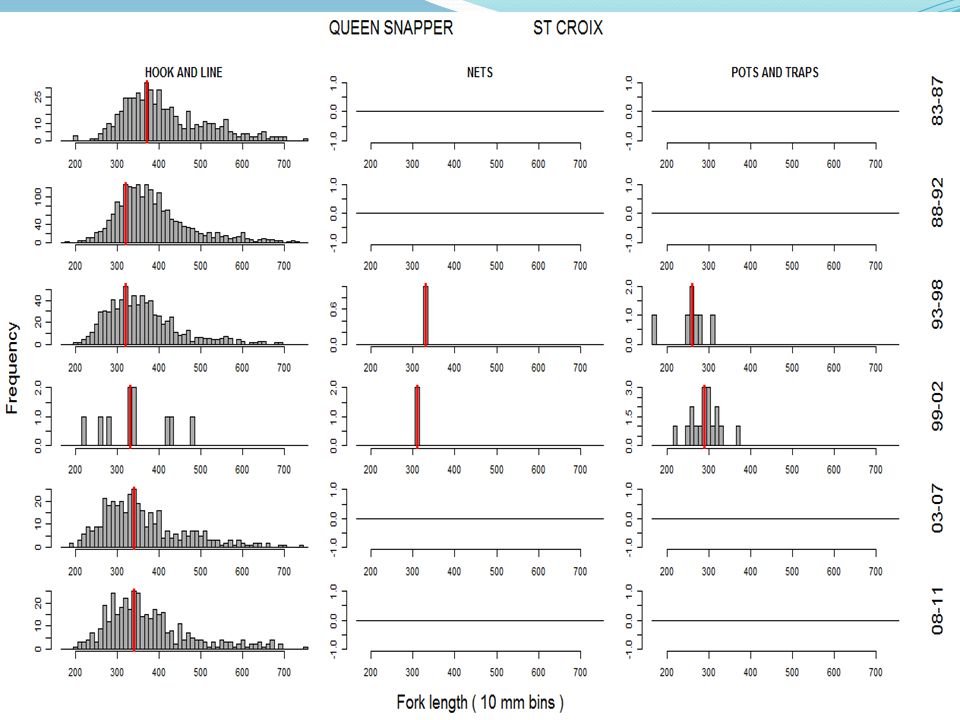
 Photo from: www.incognitolighttackle.com/photos.htm.>")

 4.1.1 Action 1(a) Grouper units Alternative.>")


 in the U.S. Virgin Islands CRP Funded Project NMF4540114.>")


 Center for the Advancement of Population.>")


>")

 has previously stated.>")