Download presentation
Presentation is loading. Please wait.

1
HAROLD BROOKS NOAA/NSSL HAROLD.BROOKS@NOAA.GOV Tornado deaths: What the past tells us about the future

2
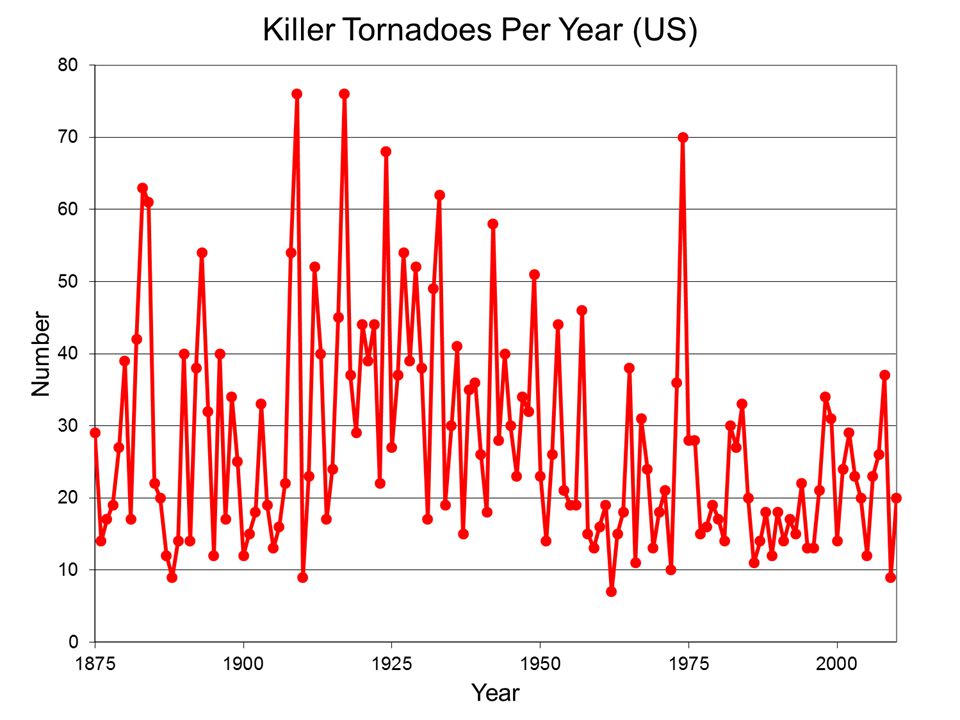
harold.brooks@noaa.gov General History of Death >20000 people have died in US tornadoes (~400 years) Deadliest decade-1920s (95 min, 4 years>200, 3169 total) 1986-1995: 419 deaths 2000-2009: 558 deaths Only 3 years since 1974 > 100, max is 130 (1998)
 Deadliest decade-1920s (95 min, 4 years>200, 3169 total) : 419 deaths : 558 deaths Only 3 years since 1974 > 100, max is 130 (1998)")
3
10 Years of Tornado Fatalities by County 631 Total Fatalities 1999-2008 Avg. Fatalities ~2.5 Avg. Injuries ~21 Avg. Prop. Dmg. ~$18M Avg. Track ~18 miles Avg. Width ~500 yards Avg. Rating ~(E)F2.5
F2.5.")
8
harold.brooks@noaa.gov What happened in 1925? 8 Seminal weather events that changed society 1888 Blizzard 1900 Galveston Hurricane 1927 Mississippi River flood 1930s Dust Bowl 1925 Tri-State tornado

10
Mobile Home Permanent Home

12
harold.brooks@noaa.gov

13
13

14
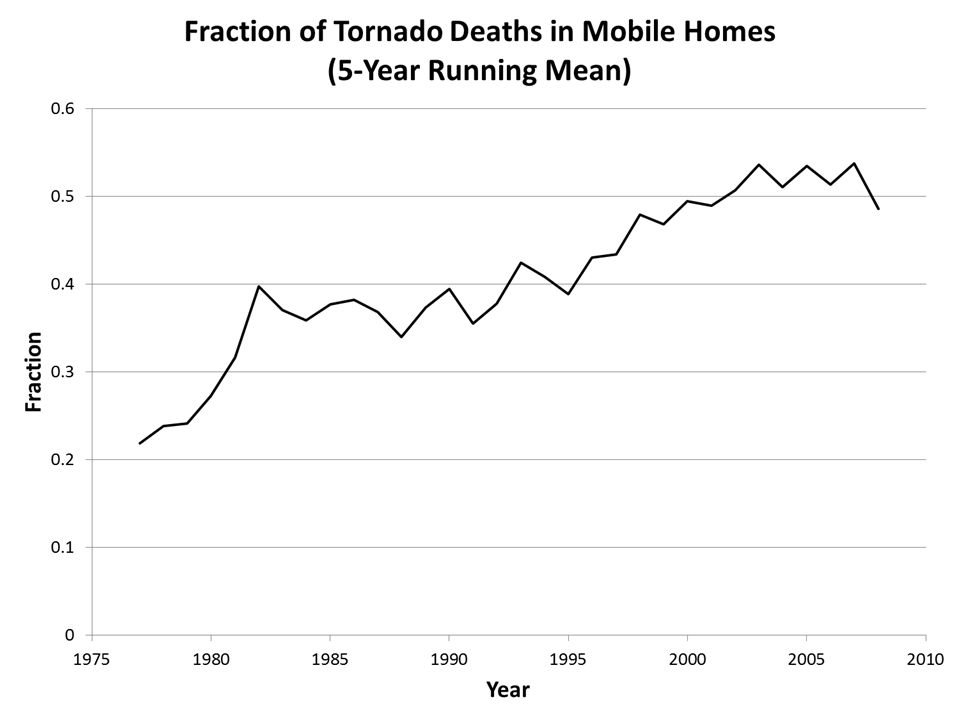
harold.brooks@noaa.gov Brooks and Doswell (2001) 14 Highlight role of education in reducing 3 May 1999 deaths Question whether downward trend (post-1925) stopped Model death rate as function of mobile home fraction
 14 Highlight role of education in reducing 3 May 1999 deaths Question whether downward trend (post-1925) stopped Model death rate as function of mobile home fraction")
15
Model Tornado Deaths (Brooks and Doswell 2001) Mobile home contribution to overall death rate
 Mobile home contribution to overall death rate")
16
Mobile Home Permanent Home

17
harold.brooks@noaa.gov Warning/response system 17 Warning Decision Dissemination Reception Response Preparation Options Action

18
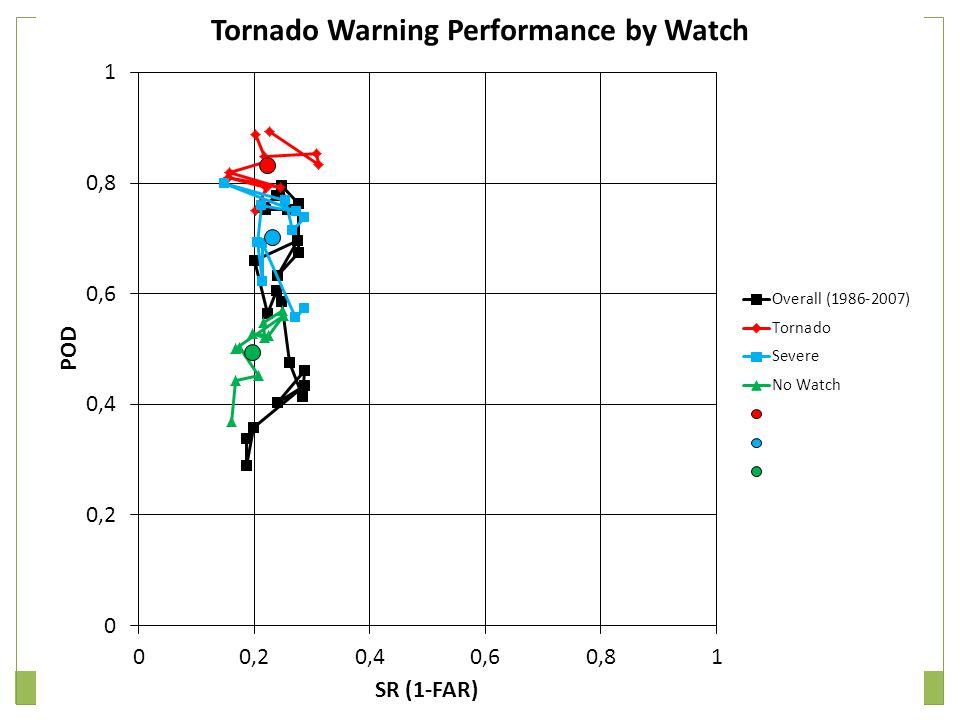
harold.brooks@noaa.gov Warning performance 18 Lead time? Lead time for warned tornadoes hasn’t changed in 25 years

19
harold.brooks@noaa.gov 19

21
harold.brooks@noaa.gov Warning performance 21 Lead time? Lead time for warned tornadoes hasn’t changed in 25 years POD has increased Sutter and Simmons-decrease in fatalities up to 15 minutes Hoekstra Preferred mean lead time 34 minutes Given 1 hour lead time, respondents less likely to act immediately, more likely to flee Stalker-Long lead-people prepared to take action False alarms? Many convolved factors (SE primarily) What do people think is a warning for them?
 What do people think is a warning for them .")
22
harold.brooks@noaa.gov What are the issues? 22 Organization of storms (warning challenges) Ashley (2007) summarizes many aspects Mobile homes Nocturnal/visibility Poverty Preparation/response
 Ashley (2007) summarizes many aspects Mobile homes Nocturnal/visibility Poverty Preparation/response.")
23
Nocturnal Tornado Death FractionMobile Home Fraction by County Forest CoverFraction in Poverty (Ashley 2007)
")
24
harold.brooks@noaa.gov Compare to lightning 24 Which kills more in US?

26
harold.brooks@noaa.gov Compare to lightning 26 Which kills more in US? 1976-90: Lightning ( =90), tornado (53), lightning more in 13 years 1996-2010: Lightning (41), tornado (63), lightning more in 3 years Lightning deaths dropped dramatically starting ~1990 Education-“30-30 rule” Training-ER docs less likely to kill you now than 25 years ago
, tornado (53), lightning more in 13 years : Lightning (41), tornado (63), lightning more in 3 years Lightning deaths dropped dramatically starting ~1990 Education rule Training-ER docs less likely to kill you now than 25 years ago.")
27
harold.brooks@noaa.gov Final thoughts 27 Reducing deaths won’t come by improving forecast quality (lead time, POD, FAR) Non-meteorological problem Education/preparation Choices for appropriate action Communication of messages
 Non-meteorological problem Education/preparation Choices for appropriate action Communication of messages")
Similar presentations


 Alan Gerard NWS Jackson Sixth Annual Southeast Severe Storms.>")

