Download presentation
Presentation is loading. Please wait.

1
Introduction to Cartographic Design
Richard Taketa Associate Professor Department of Geography San Jose State University

2
Basic Map Design Visual organization Improve legibility
Focus attention Maps do not have a natural sequence Design can guide the map reader Make the reader’s job easier

3
Today’s Design Topics Figure-ground Layout Generalization
Symbolization

4
Figure-Ground

5
Figure-Ground Graphic characteristics Some elements as figures
Other elements as background

6
Can’t easily distinguish elements
Figure-Ground Can’t easily distinguish elements

7
Figure-Ground How people see graphics Elements Contrast Contour
Closure Enclosure Visual organization

8
More contrast = stronger figure

9
Not just the darker element
Contrast Not just the darker element

10
Sharper contour (edge) = stronger figure
 = stronger figure")
11
Closed element = stronger figure
Closure Closed element = stronger figure

12
More enclosed = stronger figure
Enclosure More enclosed = stronger figure

13
Create Visual Levels

14
Figure-Ground

15
Figure-Ground

16
Figure-Ground

17
Figure-Ground

18
Layout

19
Layout Arrangement of map elements Objectives Visual balance Structure

20
Centering is a good starting point...

21
Poor balance = harder to read

22
Assign appropriate emphasis

23
Text Placement: Figural Object

24
Text Placement: Background Object

25
Text Placement: Enhance Pattern

26
Text Placement: Hide Pattern

27
Generalization

28
Generalization Level of detail Function of Purpose Scale
Graphic limits Quality of data

29
Generalization Simplification Selection Classification Symbolization
Induction

30
GIS Data Detailed

31
Detail a Problem for Symbolization

32
Simplifying for Clarity
Loss of information…negligible

33
Detail Changes with Scale

34
Symbolization

35
Symbolization Most maps involve abstract symbols
Represent features of interest Can’t always show them as they actually look

36
Graphic Variables Shape Size Color Hue Lightness Saturation
Orientation Pattern Texture

37
Levels of Measurement Nominal Ordinal Interval Ratio

38
Symbolization & Measurement
Nominal Ordinal Interval/Ratio x x x x - Shape Size Color Hue Lightness Saturation Orientation Pattern Texture

39
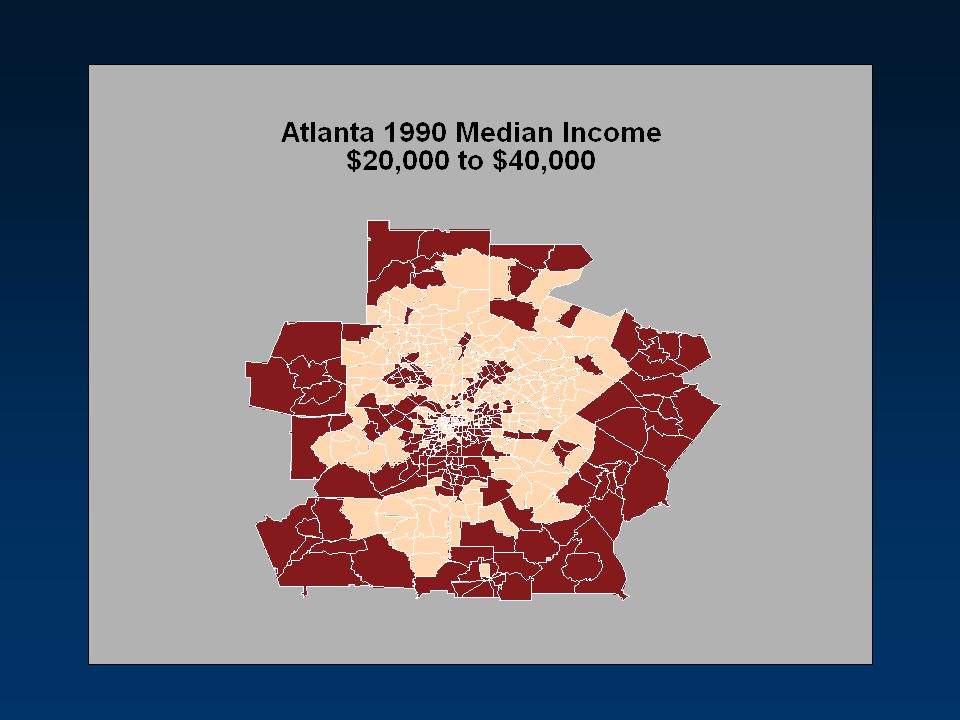
Symbolization

40
Symbolization Can affect ability to see patterns
Complex symbolization and classifications can obscure

47
Map Design Summary Organize graphic information Provide structure
Make the map legible Focus the reader’s attention

48
Guide the reader...

49
Contact Information Richard Taketa Department of Geography San Jose State University One Washington Square San Jose, CA

Similar presentations


 Work on Lab 5 (if time remains) June 7, 2007.>")


 Bread Crumb Trail.>")


