Download presentation
Presentation is loading. Please wait.

1
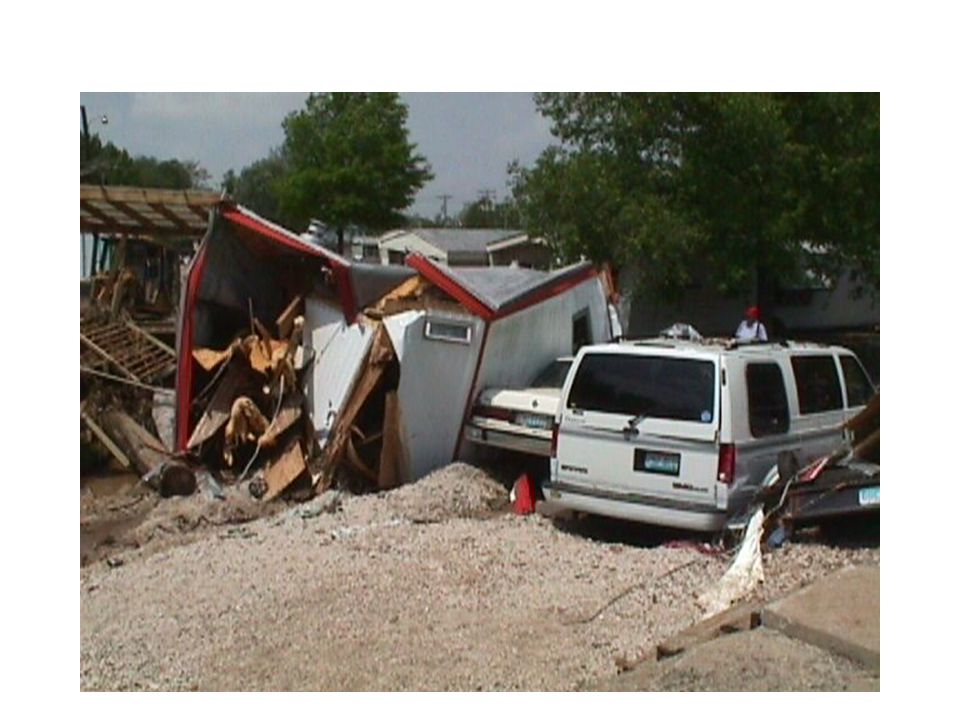
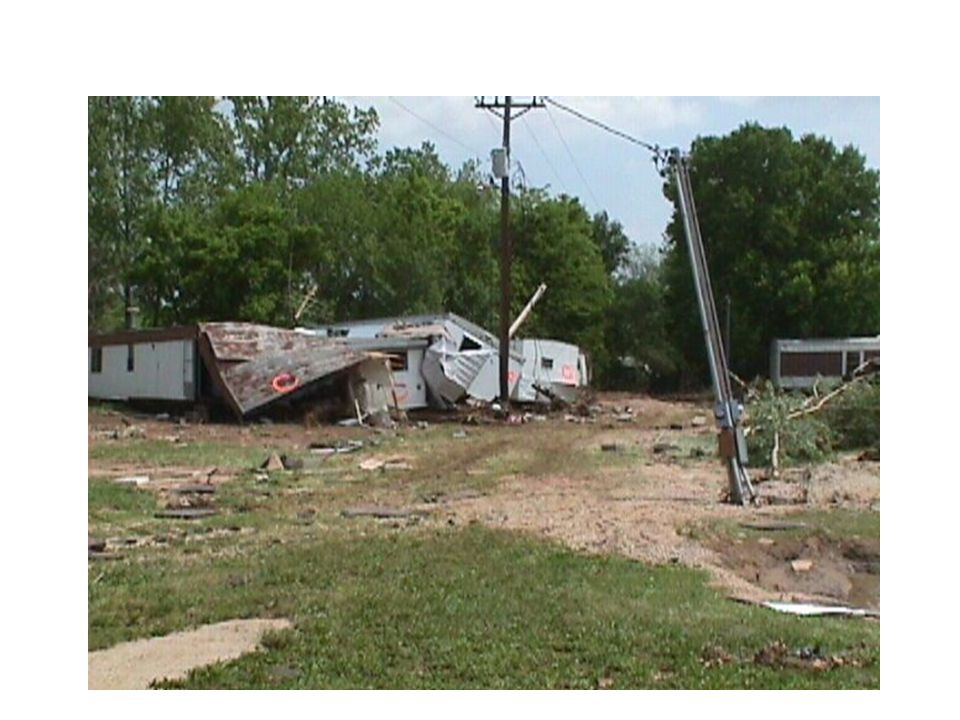
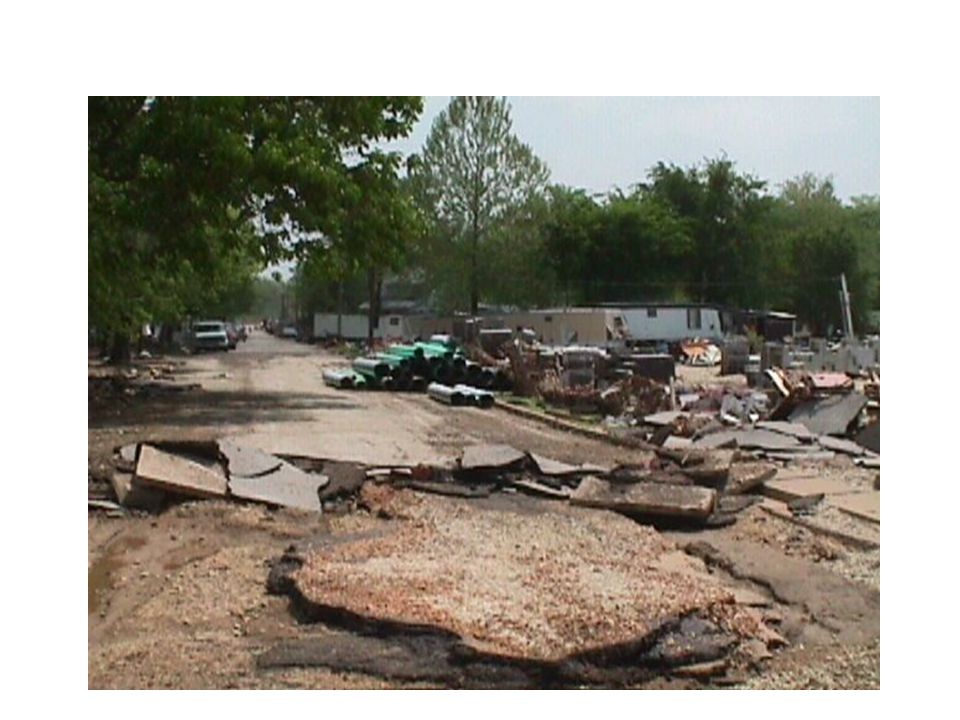
Extreme Heavy Rain in Franklin County, Missouri Occurred during the nighttime and early hours of 6-7 May 2000 Rainfall exceeding 4 inches (100 mm) fell over a 5500 km 2 area, with embedded amounts over 12 inches (300 mm) There were two fatalities and property damage of over 100 million dollars 379 structures damaged or destroyed in Franklin County; declared a disaster area by the President Flat Creek in Franklin County rose about 15 feet (4.57 m) destroying two mobile home parks.
 fell over a 5500 km 2 area, with embedded amounts over 12 inches (300 mm) There were two fatalities and property damage of over 100 million dollars 379 structures damaged or destroyed in Franklin County; declared a disaster area by the President Flat Creek in Franklin County rose about 15 feet (4.57 m) destroying two mobile home parks.")
2
GOES-8 Infrared Satellite Loop Valid 1815 UTC 6 May 2000 to 1815 UTC 7 May 2000

3
KLSX WSR-88D Reflectivity Loop (dBZ) Valid 0415 UTC to 1100 UTC 7 May 2000
 Valid 0415 UTC to 1100 UTC 7 May 2000")
4
KLSX WSR-88D storm total precipitation estimate for 04 UTC to 11 UTC 7 May 2000

5
24-Hour Precipitation Analysis for the Period Ending 1200 UTC 7 May 2000

6
Accumulated Rainfall (Grey) 30 Minute Rainfall (Blue)
 30 Minute Rainfall (Blue)")
7
Loop of one-hour KLSX WSR-88D rainfall estimation for the time period 04 UTC to 11 UTC 7 May 2000

8
Flat Creek Watershed – Union, MO

14
Surface Analysis Valid 04 UTC 7 May 2000

15
Surface Analysis Valid 06 UTC 7 May 2000

16
Surface Analysis Valid 08 UTC 7 May 2000

17
Surface Analysis Valid 10 UTC 7 May 2000

18
RUC Initialization 950 mb to 850 mb Layer-Averaged Wind Vectors and Isotachs Valid 06 UTC 7 May 2000

19
RUC Initialization 950 mb to 850 mb Layer-Averaged Wind Vectors and Isotachs Valid 09 UTC 7 May 2000

20
RUC Initialization 950 mb to 850 mb Layer-Averaged Wind Vectors and Isotachs Valid 12 UTC 7 May 2000

21
Vertical Wind Profile Display from the KLSX WSR-88D Valid 0400 UTC to 0500 UTC 7 May 2000

22
Vertical Wind Profile Display from the KLSX WSR-88D Valid 0500 UTC to 0600 UTC 7 May 2000

23
Vertical Wind Profile Display from the KLSX WSR-88D Valid 0600 UTC to 0700 UTC 7 May 2000

24
Vertical Wind Profile Display from the KLSX WSR-88D Valid 0700 UTC to 0800 UTC 7 May 2000

25
Vertical Wind Profile Display from the KLSX WSR-88D Valid 0800 UTC to 0900 UTC 7 May 2000

26
Vertical Wind Profile Display from the KLSX WSR-88D Valid 0900 UTC to 1000 UTC 7 May 2000

27
Vertical Wind Profile Display from the KLSX WSR-88D Valid 1000 UTC to 1100 UTC 7 May 2000

28
KLSX WSR-88D plane view of the cross- section of reflectivity (dBZ) from 0415 UTC to 0831 UTC 7 May 2000 A B
 from 0415 UTC to 0831 UTC 7 May 2000 A B")
29
AB KLSX WSR-88D Cross-Section Valid 0415 UTC to 0831 UTC 7 May 2000

30
B KLSX WSR-88D plane view of the cross- section of reflectivity (dBZ) from 0730 UTC to 1100 UTC 7 May 2000 A B
 from 0730 UTC to 1100 UTC 7 May 2000 A B")
31
AB KLSX WSR-88D Cross-Section Valid 0731 UTC to 1100 UTC 7 May 2000

32
KLSX WSR-88D Storm Relative Velocity Valid 0415 UTC to 1100 UTC 7 May 2000

33
Diagnostic View of the Propagation Vectors Prognostic storm-motion vectors are calculated using the LLJ and mean 850-300 mb wind vectors (Corfidi 1996) In this case, the prognostic vectors that were calculated gave an erroneous system-motion speed and direction because they relied solely on the LLJ “True” propagation vectors were calculated using the satellite-derived system motion and radar-derived cell motion vectors to obtain the actual nature of the propagation The finding that propagation is influenced by more than the LLJ is consistent with earlier work by Moore et al. (1993) and Corfidi (1998) In this case, propagation appeared to be influenced by the outflow boundary, mesolow, and the LLJ
 and Corfidi (1998) In this case, propagation appeared to be influenced by the outflow boundary, mesolow, and the LLJ.")
34
Prognostic and Diagnostic Corfidi Vector Diagrams Valid 0500 UTC 7 May 2000 FORECASTACTUAL

35
1000 – 900 mb Moisture Convergence Valid 0500 UTC 7 May 1999

36
FORECASTACTUAL Prognostic and Diagnostic Corfidi Vector Diagrams Valid 0600 UTC 7 May 2000

37
Propagation Composite Chart Valid 0600 UTC 7 May 2000 LLJ ULJ Moisture Convergence (gm kg -1 hr -1 ) 900-600 mb Convective Instability 900-800 mb Layer Average MTV (gm kg -1 m s -1 )
 mb Convective Instability mb Layer Average MTV (gm kg -1 m s -1 )")
38
FORECASTACTUAL Prognostic and Diagnostic Corfidi Vector Diagrams Valid 1100 UTC 7 May 2000

39
1000 – 900 mb Moisture Convergence Valid 1100 UTC 7 May 1999

40
Diagnostic Corfidi Vector Loop Valid 0500-1100 UTC 7 May 2000

41
Modification to the “Vector Approach” Corfidi (1998, SLS Preprint) has noted that the environments of back-building convection and bow echoes/derechoes often look similar – even though bow echoes are distinctly forward propagators Forward propagation is favored by the presence of unsaturated air – either in the mid-levels or sub-cloud layer – ahead of the developing MCS. Quasi-stationary/back-building MCSs are associated with more nearly saturated lower tropospheric environments. It is the potential to produce strong downdrafts at the surface and therefore the formation of a strong mesohigh that distinguishes the bow echo/derecho environment from that more conducive to a back-building MCS. The mesohigh helps maximize system-relative convergence downstream from the MCS

42
CONCLUSIONS The heavy rain event that occurred during the nighttime hours of 7 May 2000 was due to regenerative convection which resulted in a quasi- stationary MCS Franklin County, MO was deluged with over 10 inches of rain in a six-hour period, with some portions of the county receiving 14-16 inches Catastrophic flooding occurred along Flat Creek watershed which runs through the center of Union in Franklin County. Damage estimates exceeded $100 million.

43
CONCLUSIONS (cont.) The heavy rainfall event in MO was part of a cyclic heavy rainfall system associated with a mid-level, warm core vortex As the convective system grew, a weak outflow boundary became aligned parallel to the upper-level flow and nearly normal to the LLJ As the MCS matured, a weak surface mesolow formed upstream from the convection, further enhancing low-level convergence Diagnostic calculations of the propagation vector revealed that the storm motion remained < 3.5 m s -1
 The heavy rainfall event in MO was part of a cyclic heavy rainfall system associated with a mid-level, warm core vortex As the convective system grew, a weak outflow boundary became aligned parallel to the upper-level flow and nearly normal to the LLJ As the MCS matured, a weak surface mesolow formed upstream from the convection, further enhancing low-level convergence Diagnostic calculations of the propagation vector revealed that the storm motion remained < 3.5 m s -1")
44
CONCLUSIONS (cont.) Vector analysis further reveals that the propagation vector was opposite to the cell motion vector signaling a quasi-stationary MCS The Corfidi Vector Method was inappropriate in this case as the storm-relative inflow was NOT solely a function of the LLJ The heavy rain environment was characterized by: weak mid-upper level wind shear high mean surface-500 mb RH deep warm cloud depths (~3.3 km) PW values > 175% of normal (> 1.3 inches) modest CAPE values (500-1000 J kg -1 )
 Vector analysis further reveals that the propagation vector was opposite to the cell motion vector signaling a quasi-stationary MCS The Corfidi Vector Method was inappropriate in this case as the storm-relative inflow was NOT solely a function of the LLJ The heavy rain environment was characterized by: weak mid-upper level wind shear high mean surface-500 mb RH deep warm cloud depths (~3.3 km) PW values > 175% of normal (> 1.3 inches) modest CAPE values ( J kg -1 )")
45
CONCLUSIONS (cont.) High e air (> 340 K) resided to the southwest of the MCS The MCS formed downstream from a maxima in the 850 mb moisture transport vectors The various Eta model QPFs were on the order on 0.5 inches for the 18 h period. One would not expect numerical models to be able to handle this meso- scale heavy rain event – especially a hydrostatic model with an inability to simulate downdrafts (albeit weak ones)
.")
46
This presentation can be viewed and/or downloaded at the following web site: http://www.eas.slu.edu/CIPS/Presentations In addition, Fred Glass of the NWSFO in St. Charles, MO has written a preprint for the 81st Annual AMS meeting. To obtain a copy of this preprint email Fred at: Fred.Glass@noaa.gov

Similar presentations


 that may contain a stratiform rain region.>")


 Chris Davis (NCAR ESSL/MMM and RAL) Stan Trier (NCAR ESSL/MMM) Boulder, Colorado 60-h Radar Composite Animation (00.>")


