Download presentation
Presentation is loading. Please wait.

1
Economics of Food Demand Dr. George Norton Agricultural and Applied Economics, College of Agriculture & Life Sciences, Virginia Tech International Agricultural Development and Trade AAEC 3204

2
Objectives Today Identify determinants of food demand Begin discussion of income elasticities and price elasticities of demand

3
Effective demand for food Food Need

4
Determinants of Food Demand Income Price (own) Price (substitutes + complements) Population Habits, customs, preferences
 Price (substitutes + complements) Population Habits, customs, preferences")
5
Figure 1: Demand Curves 0 500 1000 1500 2000 2500 200 150 100 50 B A Price, $ per ton Quantity, million tons per year Demand curve at higher income (D’) Demand curve at low income (D) B’ A’
 Demand curve at low income (D) B’ A’")
6
Engel’s Law & Bennett’s Law Engel’s Law -- As income increases, people spend a smaller proportion of their total income on food. Bennett’s Law -- The richer one becomes, the less he or she spends on starchy staples

7
Measure of Income Growth on Demand Income elasticity of demand: How do we measure the effect of income growth on the demand for a commodity?

8
Size of income elasticities Normal Goods? Normal Goods? Zero to oneZero to one Superior Goods? Superior Goods? Greater than oneGreater than one Inferior Goods? Inferior Goods? NegativeNegative

9
Income elasticities of demand for agricultural commodities in Sub-Saharan Africa Wheat.92 Rice.93 Maize.46 Millet.15 Roots & tubers-.04 Pulses-.14

10
Income elasticities differ by country CerealsBeefMilk Brazil.15.58.45 Nigeria.171.201.20

11
Own Price Elasticity of Demand E p > |-1| Elastic = -1 Unitary elasticity < |-1| Inelastic Price Quantit y inelastic elastic

12
Income Effect If the price of a commodity increases, the real purchasing power of a given amount of income is reduced, causing demand to change because of an “income effect”.

13
Cross Price Elasticity of Demand + Substitutes 0 unrelated - complements

14
How are elasticity estimates obtained?

15
PrPr QrQr (if in logs)
")
16
Homogeneity Condition own price elasticity income elasticity Cross price elasticities

17
Example of using homogeneity condition CommodityCross-price elasticity Rice & beans-.35 Rice & wheat.60 Rice & chicken.10 Rice & milk-.05 Rice & other goods0 Income elasticity of demand for rice.4 How much would the rice price have to decrease in order to increase rice consumption by 7%?

18
What happens to aggregate food demand as income grows? D = P + ng D = rate of growth of demand P = rate of population growth n = income elasticity of demand g = rate of growth of per capita income

19
D = P + ng Example: D = 3.0 +.9(-3) =.3 D = 2.5 +.7(3) = 4.6 Change in Aggregate Food Demand
 =.3 D = (3) = 4.6 Change in Aggregate Food Demand")
20
Level of income Rate of populatio n growth Rate of per capita income growth Income elasticity of demand Rate of growth in demand Very low2.50.51.03.0 Low3.01.00.93.9 Medium2.54.00.75.3 High2.04.00.54.0 Very high 1.03.00.21.6 D = P + ng

21
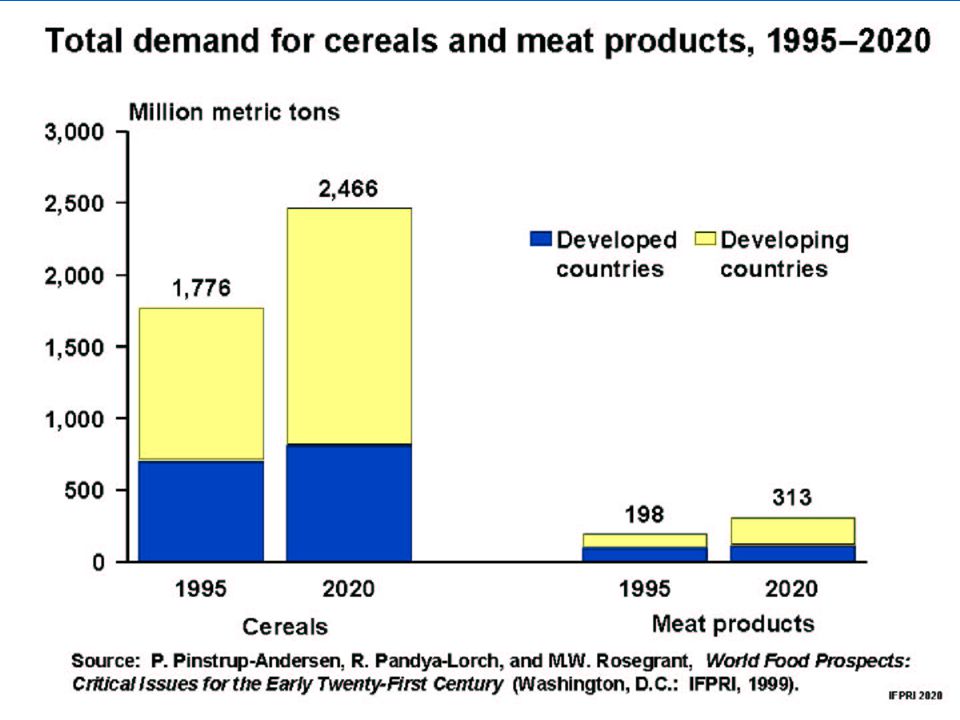
Commodity Trends and Projections Cereal demand (food, feed) Meat demand Grain production in LDCs Grain imports in LDCs U.S. grain exports Food prices Per capita food availability in LDCs Child malnutrition

23
Cereal Imports by Region

24
Net Trade by Region

25
Growth in Cereal Production

26
Cereal Yields by Region

27
Factors Affecting Real Price Supply factors? Supply factors? factors? Demand factors? What are some of the factors that will affect the real price of food over the next 10 – 20 years?

28
Factors affecting location of the supply curve Technology Number of sellers Substitutes in production Input cost Price Quantity S1S1 S2S2

29
Using Supply & Demand Curves 1. 1. For a commodity? 2. 2. For groups of commodities? How can one use supply and demand curves to predict future price changes?

30
Price Quantity P1P1 Q1Q1 Supply Demand

31
Rate of Growth of Agricultural Prices % change P = % change F - % change Q price elasticity of demand P = price F = production Q = quantity demanded

32
How do agricultural prices affect the poor Farmers? Consumers? Indirect effects? if

33
Conclusions 1. 1. Income increases for the poor can have a large effect on nutrition because poor spend a high proportion of their budget on food. 2. 2. Need to increase supply for commodities with high income elasticity of demand (n). Otherwise, prices will rise 3. 3. If n is low, but country wants to increase consumption of a good, need education or a subsidy. 4. 4. At world level: shift to feed grains as income rises.
. Otherwise, prices will rise If n is low, but country wants to increase consumption of a good, need education or a subsidy At world level: shift to feed grains as income rises..")
Similar presentations

 Tutorial 3. Price Elasticity of Demand Relationship between a change in price and the change in demand. The more elastic is demand the greater.>")


 Law of dd b) Determinants of dd c) Changes in dd vs changes in qt demanded d) Elasticity of dd : P, cross,>")


