Download presentation
Presentation is loading. Please wait.

1
Yu. I. BARANOV and W. J. LAFFERTY Optical Technology Division Optical Technology Division National Institute of Standards and Technology, Gaithersburg, MD 20899-8441, USA The water vapor continuum absorption in the 8 to 12 μm region at temperatures from 311 to 352K.

2
Introduction The water vapor continuum absorption in the atmospheric 8 to 12 μm window strongly affects the Earth’s outgoing radiation and therefore is of great importance for radiative balance calculations. Over the past twenty years many groups in the world have used long-base (up to 100 m) long-path (up to several thousands m) cells to measure the H 2 O continuum.
 long-path (up to several thousands m) cells to measure the H 2 O continuum..")
3
Introduction The other high-sensitive techniques, like photo-acoustic or cavity ring-down spectroscopy were also employed for these measurements. Nevertheless the existing data is not adequate to match the current requirements.

4
Introduction How to measure the continuum with the 2 m base multi-pass cell available at NIST? Is this possible? This is certainly not possible at room or lower temperatures because of the low vapor pressure of H 2 O at these temperatures.

5
Introduction The solution is to make the measurements at an elevated temperature. This allows one to fill the cell with water vapor at pressures up to several tens of torrs. This is enough to make continuum absorption measurable with the available path length of about 100 m since the continuum absorbance increases as the square of the water vapor pressure (density).
..")
6
Experimental set-up view

7
Specific experimental details for H 2 O continuum measurements 1. How to avoid water vapor condensation? All of the protrusive parts of the cell, such as valves, window holders, sleeves etc., were equipped with additional electric heaters and coated with thermoinsulation. This was done in order to provide uniform temperature all of the parts of the internal cell surface and to avoid water vapor condensation. Six additional thermocouples were set up to measure and control temperatures.

8
Specific experimental details for H 2 O continuum measurements 2. How to get water vapor? The water vapor sampler is a horizontally positioned stainless steel cylinder with distilled water. The sampler is equipped with electric heater and thermoinsulation. The liquid water temperature was kept close to the cell body temperature. In order to save a thermal equilibrium and the optic stability we spent over 30 minutes to fill the cell with water vapor.

9
Specific experimental details for H 2 O continuum measurements 3. How to measure water vapor pressure? The gauge (Barocell 600A, 100 torr) for water vapor pressure measurement is also heated up to the cell body temperature. We calibrated it periodically filling the cell with nitrogen and measuring the pressure with the second gauge (MKS Baratron 270, 1000 torr), operating under regular temperature. The calibration dependence was found linear and stable. The pressure estimated systematic error is about 0.6%.
 for water vapor pressure measurement is also heated up to the cell body temperature. We calibrated it periodically filling the cell with nitrogen and measuring the pressure with the second gauge (MKS Baratron 270, 1000 torr), operating under regular temperature. The calibration dependence was found linear and stable. The pressure estimated systematic error is about 0.6%..")
10
Experimental conditions Spectral resolution is 0.1cm -1

11
Experimental conditions Spectral resolution is 0.1cm -1 Why so low ?

12
Experimental conditions Spectral resolution is 0.1cm -1 Possible minimal Intensity of the instrument’s beam Why so low ?

13
Experimental conditions Spectral resolution is 0.1cm -1 Possible minimal Intensity of the instrument’s beam Acceptable signal to noise ratio: 200 – 300 scans Why so low ? +

14
Experimental conditions Spectral resolution is 0.1cm -1 Possible minimal Intensity of the instrument’s beam Acceptable signal to noise ratio: 200 – 300 scans Reasonable time of scanning: few hours Why so low ? ++

15
Experimental conditions Spectral resolution is 0.1cm -1 Possible minimal Intensity of the instrument’s beam Acceptable signal to noise ratio: 200 – 300 scans Reasonable time of scanning: few hours Why so low ? = 0.1cm -1 ++

16
Experimental conditions Temperature K (±0.3K) Pressure range torr Path length m Number of spectra 310.821.2 to 45.480-11635 318.025.5 to 55.784-11640 325.833.7 to 86.392-11643 339.342.4 to 90.892-11647 351.943.2 to 11384-11633 Spectral resolution is 0.1 cm -1
 Pressure range torr Path length m Number of spectra to to to to to Spectral resolution is 0.1 cm -1")
17
An example of IR water vapor spectrum

19
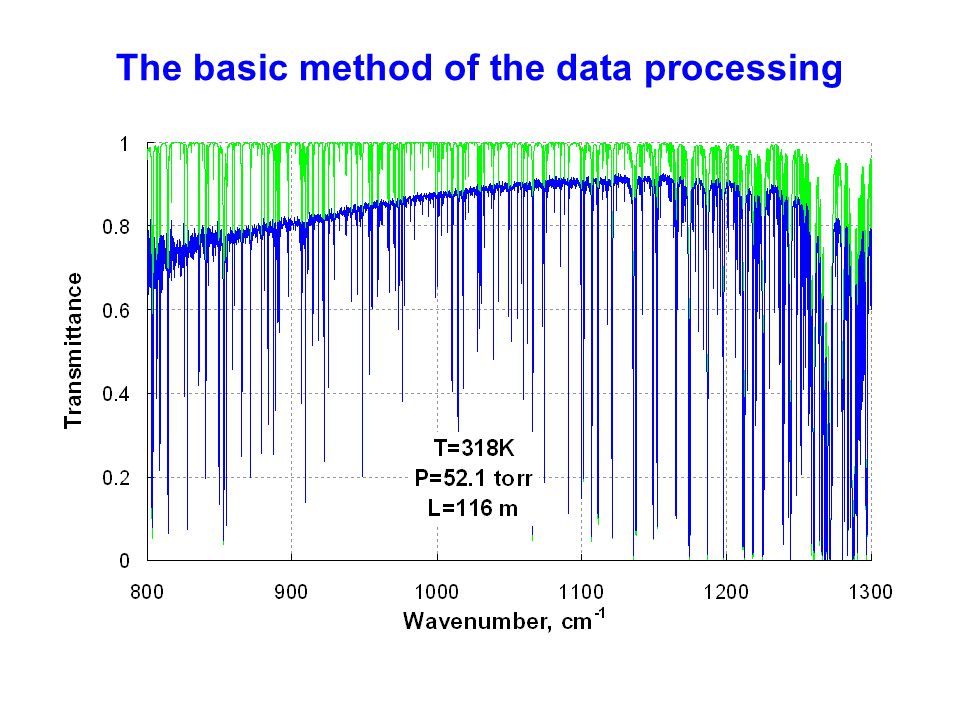
The quick data treatment method

23
The temperature dependence of the continuum binary absorption coefficient at 942 cm -1

26
The water vapor continuum absorption coefficients

27
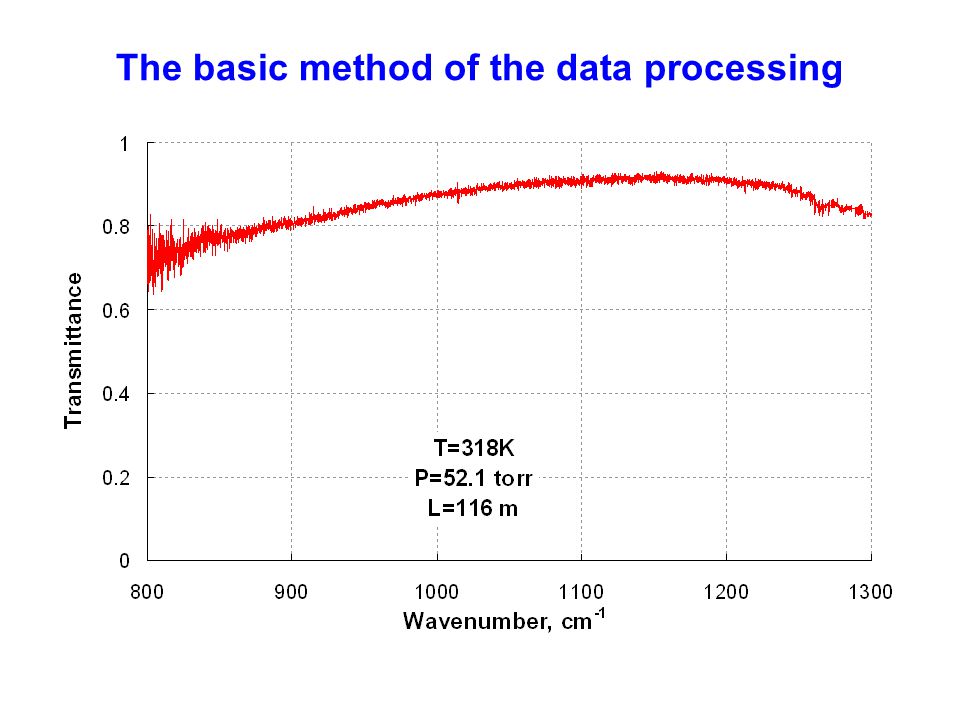
The basic method of the data processing

32
Summary Pure water vapor spectra have been recorded over a wide range of temperatures and pressures. Continuum binary absorption coefficients have been determined in the region 800 cm -1 to 1150 cm -1. Our data at 944 cm -1 have been compared with the data obtained recently by use of CRD spectroscopy technique. The systematic difference exceeds 10%. But relative changes of absorption coefficient with temperature are in good agreement. Ro-vibrational structure has been calculated using the HITRAN data base and compared with experimental spectra. This comparison shows that the HITRAN water vapor absorption line intensities need to be corrected.

Similar presentations


 Introduction IR Raman>")
>")
 Deutsches Zentrum für Luft- und Raumfahrt (DLR) Shepard A. Clough Clough Radiation.>")


 Stephen Ball & Simon Neil (Leicester University) CAVIAR science meeting, NPL,>")
 June 2006 Pure water vapor continuum measurements.>")

>")


